Stop&Shop Gives Back
Sarah Caso, Theresa Machemer, Amy Vogel
The data say that food insecurity is spread across Massachusetts, and by mapping it, epicenters of food insecurity become visible. The data also say that institutions around Massachusetts produce a significant amount of food waste. Stop&Shop is one of these institutions and their store locations are correlated with food insecurity epicenters.
We wanted to tell this story as PR managers at Stop&Shop. Stop&Shop already has programs in sustainable food waste management, one aspect of which is food rescue by donating to local food banks. The goal of sharing this community-focused and environmentally-friendly message is to bring new audiences into the store. Our audience is environmentally-minded millennials who may currently shop at Whole Foods and Trader Joe’s, but with our campaign, may be convinced to look into their local Stop&Shops instead. As students, it is interesting for us to share this message from Stop&Shop’s perspective as a way to branch out from presenting from the point of view of activists and educators, who may tell these stories more often than corporate figures. Our goals are to show how Stop&Shop is helping local communities and convince our audience both to shop at Stop&Shop and to support local food banks.
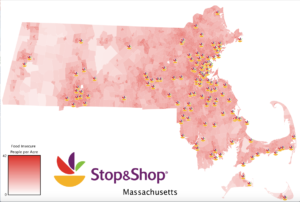
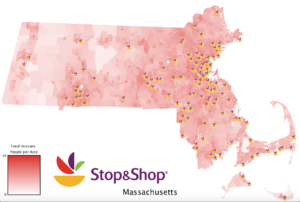
We used the Hunger in America data from Feeding America and MA Food Waste data set to tell a story. The Hunger in America data provides county-level information on the percentage and count of food insecure people, the same data for just children, the percentage who are SNAP-eligible, the total annual budget shortfall to feed everyone who is food insecure, and the average cost per meal. The MA Food Waste data includes information on the entity producing waste, the location of the entity, and the tons of waste per year generated. Our final product is a dynamic map showing food insecure people per acre in Massachusetts, the Stop & Shop locations in MA, and the projected reduction in food insecure people per acre after Stop & Shop donates meals to curb food insecurity and prevent waste. Based on research of Stop & Shop’s current initiative to donate, compost, or recycle 90% of their waste by 2020, we approximated the amount of waste they would be able to donate at the onset of their campaign to be 60%. We also made a map of the number of meals donated per acre each day. The maps we made are appropriate because we are telling a geographic story: the Stop & Shops have decided to donate to food banks within a 5 mile radius of each location, so the reduction in food insecurity in a given block largely depends on its location (along with the amount of food waste that particular Stop & Shop generates). Showing the data in geographic form rather than a chart makes the story more compelling because the audience can see affected areas, and as residents of Massachusetts, probably have an emotional connection to some/many of these places. For example, the zoomed-in “before” and “after” maps of Cape Cod show a visible amount of food insecurity reduction in a few blocks that people are probably quite familiar with because either they live there, they know somebody else that does, and/or they visit the Cape during the summer. The map brings the issue closer to home for the viewers and allows them to physically see the effect on places they recognize better than reading a list of numbers would.
“Before” Map:

“After” Map:

Link to all media:
https://drive.google.com/drive/folders/1N4VraOqmHTrO9ak0oMsAYpDEM3jmCzJe?usp=sharing