A Day of Data: Sunday, February 26

Sunday started with a horrifying notification on my iPhone: my weekly Screen Time Report was available. Despite setting screen time goals for all apps Apple identifies as “social media” (including, curiously, my calendar and calculator widgets), my usage was up 22% from last week. This prompted me to delete the facebook app from my phone, which sent a push notification to the web version reminding me to re-download the app. The fluidity with which my data is transmitted between devices disturbed me, but not enough to stop using the platform.

I continued to surf the internet for more time than I’d like to admit. I’ve long abandoned any sense of privacy on the internet, so the data collected at my most frequently visited sites (Twitter, different e-commerce outposts, Gmail) barely even registers. I read an article about disabling Gmail’s nudge function that reminds you to respond or send follow-ups based on the time elapsed, and started to imagine a future in which highly responsive Gmail accounts are celebrated (by some form of social credit/rating). This is already happening on Facebook, where you can see the average time it takes a business account to respond to messages. What if my email response times are being measured to be used against me in the future? I disabled the nudge feature.

I continued through my rather lazy Sunday by completing printed readings, cooking meals, and doing laundry. Aside from my water and electricity use, I remained off the data grid for most of the day.

This particular Sunday happened to be Oscar Sunday, which also commemorates one of the few days during the year that I watch live, broadcast television. As the audience counts for non-streaming events dwindle, I realized that my contribution to the Nielsen ratings by tuning in live to watch the Academy Awards unfold might actually have an effect on the institution of the Oscars as a whole. The ceremony, facing falling ratings and pressure from its broadcast host, ABC, unveiled and later rolled back a series of interventions in attempt to increase the show’s ratings. These interventions, including proposing and then nixing a Best Popular Movie award and relegating certain award announcements to the commercials, were based purely on projected populations that would tune in and their respective attention spans. As a film traditionalist and award enthusiast, I forced the attendees of my Oscars party to stay through to the final credits, and not pause or fast-forward through commercials. The Nielsen ratings actually affected my behavior, instead of the other way around. I wonder how long these data will continue to be collected, given their increasing irrelevance, and how these non-sporting live events will have to change to adjust to this future.
 

The Shrinking Middle Class Data Viz

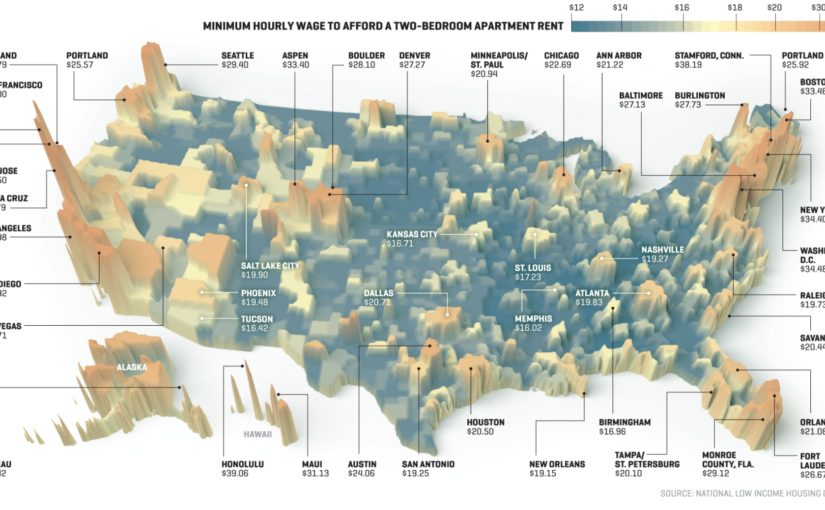
Nicholas Rapp and Matthew Heimer released a set of visualizations on Fortune this past December illustrating different metrics to understand the economic status of the American middle class amidst growing economic inequality. The map pictured above depicts the “housing wage,” or hourly wage needed by a renter to afford the rent for a 2-bedroom apartment at the Fair Market Rent (FMR) in different cities across the country.

The intended audience here is anyone who would consider themselves a member of the middle class. We know from recent studies that many more Americans believe themselves to be middle class than are in actuality, and this viz capitalizes on that outsized identification by not defining what it means by the “middle class” in income, employment, or other economic terms.

The goal of this project is to demonstrate just how economically burdened middle class Americans are as the rich grow richer. The additional graphs and charts shown in this feature show America’s “awkward global company” in being a highly unequal developed country, and how the economic standing of the American middle class has degraded over the years in terms of personal savings, retirement savings, and purchasing power.

Though I think the housing wage map is evocative, it left me with more questions than answers about the state of housing for the middle class in different US cities.  The housing wage is depicted by the height of the skyscraper over the city, which is not the clearest symbology visually: the differences do not render well across all cases, and are mostly useful in understanding the extreme outliers (San Francisco, Seattle, NYC, etc.). The color gradient is organized from low to high required hourly wages, which is logical, but the shades of blue and orange at the bottom and top of the gradient respectively are not so easily deciphered with the naked eye and comparing heights of skyscrapers for cities not geographically near one another is also challenging.

I would appreciate more context with this data, since its ultimate goal is to generalize across a class of people. Including data about how many residents achieve this hourly wage level would be helpful to understand how inclusive the housing market is of the middle class. The available documentation do not help in answering some of my questions because I have a feeling the data were compiled at different geographies (e.g. the map indicates cities, but Area Median Income (AMI) is measured at the metro level). While the map is no doubt beautiful, and is admirable for labeling large and small cities across the country (despite choosing symbology that best serves the outliers), I found its symbology more confusing than visually inventive.