Data Visualization Review

https://www.politico.com/magazine/story/2017/11/03/are-american-women-really-better-off-215782

The piece I selected is from Politico, “Are American Women really better off?” The article made visualization based on an index that measures women’s public service leadership by country. It highlights certain data from the overall dataset. For instance, the percentage of women in civil service (43.2%), the percentage of women in decision-making civil service (34.4%), and the percentage of women in ministerial positions (16.6%). The author chose to visualize it based on a scale presentation. Out of 10 “individual images”, roughly 4.32 indicates female images using red outline whereas the rest shows male images using a black outline. I thought instead of a pie chart, such illustration made it more apparent the gender gap in decision-making public service positions. In addition, there is a text and triangle indicating a global average to show where the US is compared to the global average. 
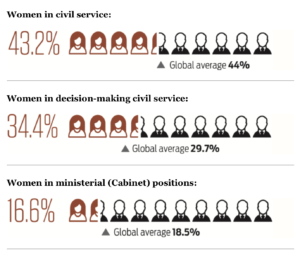
Other visualization in this article includes donut charts, bar chart and pie chart, etc.
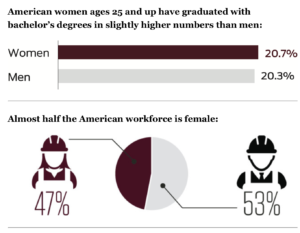
When I first read the article (right after it was published), I found the representation using personal image to indicate gender gap in positions was very effective. However, now when I look back, I found a different way to visualize may have a better impact.

Actually, I was as involved with the global women’s leadership index creation process at the Wilson Center before the index got launched. The index was created based on three pillars: pathway, position and power of women in public leadership. The rationale is that we shouldn’t solely look at positions women held – because in some context, a majority in positions doesn’t mean power (like Rwanda); in another context, there was no pathway to enable decision-making position. Therefore, the index was measured by the weighted average of three scores based on the pathway (data collected based on access to education, labor market, maternity leave, etc), position, and power(data collected based on good governance index, public perception, etc).

If I were to replicate this visualization, I would use graphics to showcase the steps from the pathway, to position and to power for women in leadership positions in a storyline – so that it is not just a creative use of individual datapoint, but to connect different data points to tell a story. I also thought when we managed to translate the numbers into human narratives using data visualization, it will not only enhance the importance of the numbers themselves but amplify the impact that can be relatable to a wider audience. 

Stamped Out: How income inequality affects food choices

Title: Stamped Out: How income inequality affects food choices

Team Members: Rubez Chong, Berlynn Bai, Philip Zhu, Nora Wu

Context: It’s Food Security Awareness Week at MIT. We’re students on campus who are trying to raise awareness on the impacts and consequences of food insecurity and inequity. We decided to put together an interactive data sculpture to get people to start thinking with their hands.

Audience: Our audience is MIT students

Summary: The data say that income inequality affects food choices in interesting and surprising ways. For example, “soft drinks” rank no. 1 for Supplemental Nutrition Assistance Program (SNAP) households and no. 2 for non-SNAP households i.e. not much of a difference at all despite the differences in income. We wanted to tell this story because we want the MIT public to breakdown and question the stereotypes about food choices by bringing to light the surprising similarities/differences in food rankings.

Our data sources come from the United States Department of Agriculture under the Nutrition Assistance Program Report in 2016. We use the data of the“Top Purchases by Expenditure for SNAP and Non‐SNAP Households” for this activity.

Why it’s appropriate: We wanted to visualize the diets of a SNAP vs. NON-SNAP and thought it would be compelling to do so with the use of a stomach sculpture. The styrofoam twirls are meant to represent different food items households purchase. It is effective in storytelling as the image of food items are vivid and the two identical stomachs help the audience empathize with the visceral impacts that income inequality has on our diet choices. The interactive “guess the rank” game highlights our perceived bias about these impacts.

References/dataset:

My Digital Log for Sunday 

Quantitative:
The time I slept at night (if I use my Fitbit while sleeping)
The time I woke up (using alarm from my phone)
Today’s weather info
The time I used to check my calendar
The time I used to find the location to meet with my friend Sarah using Google map
The time and location I required uber to a restaurant and took the T back
By the end of the day, I also collected
  • The total km I walked and calories I burned (using Fitbit)
  • The time I used my iPhone/iPad screen (productivity/entertainment etc)
  • The total amount of calories I gained through food
  • The total amount of dollars I used
Qualitative:
The conversations I have had with friends
The assignment I was working on
The photo image I took for an event
The video I recorded for an event
Social Media:
The time I liked/posted something on Facebook/Instagram/Twitter
The playlist listened to Spotify