Data Footprint 02/23-24

I recorded my digital data footprint from Saturday, Feb 23rd Sunday Feb 24th, a weekend. During this weekend, I engaged with multiple activities, and logged my data through:

Time: Saturday Morning

Activity: Working from home

  • Spotify: listened to music
  • Gmail: sent emails

Time: Saturday Noon

Activity:  Online shopping

  • Credit card: online payment

Time: Saturday Night

Activity: Dine out & grocery shopping

  • Uber: travel record & payment
  • Credit card: dinner bill
  • Credit card: grocery bill

Time: Sunday Morning

Activity: video chat with friend

  • WeChat: social network communication record


A Day of Data: Sunday, February 26

Sunday started with a horrifying notification on my iPhone: my weekly Screen Time Report was available. Despite setting screen time goals for all apps Apple identifies as “social media” (including, curiously, my calendar and calculator widgets), my usage was up 22% from last week. This prompted me to delete the facebook app from my phone, which sent a push notification to the web version reminding me to re-download the app. The fluidity with which my data is transmitted between devices disturbed me, but not enough to stop using the platform.

I continued to surf the internet for more time than I’d like to admit. I’ve long abandoned any sense of privacy on the internet, so the data collected at my most frequently visited sites (Twitter, different e-commerce outposts, Gmail) barely even registers. I read an article about disabling Gmail’s nudge function that reminds you to respond or send follow-ups based on the time elapsed, and started to imagine a future in which highly responsive Gmail accounts are celebrated (by some form of social credit/rating). This is already happening on Facebook, where you can see the average time it takes a business account to respond to messages. What if my email response times are being measured to be used against me in the future? I disabled the nudge feature.

I continued through my rather lazy Sunday by completing printed readings, cooking meals, and doing laundry. Aside from my water and electricity use, I remained off the data grid for most of the day.

This particular Sunday happened to be Oscar Sunday, which also commemorates one of the few days during the year that I watch live, broadcast television. As the audience counts for non-streaming events dwindle, I realized that my contribution to the Nielsen ratings by tuning in live to watch the Academy Awards unfold might actually have an effect on the institution of the Oscars as a whole. The ceremony, facing falling ratings and pressure from its broadcast host, ABC, unveiled and later rolled back a series of interventions in attempt to increase the show’s ratings. These interventions, including proposing and then nixing a Best Popular Movie award and relegating certain award announcements to the commercials, were based purely on projected populations that would tune in and their respective attention spans. As a film traditionalist and award enthusiast, I forced the attendees of my Oscars party to stay through to the final credits, and not pause or fast-forward through commercials. The Nielsen ratings actually affected my behavior, instead of the other way around. I wonder how long these data will continue to be collected, given their increasing irrelevance, and how these non-sporting live events will have to change to adjust to this future.
 

Data Log

I picked a Friday morning – Saturday morning (probably the most active of my days) to think about what data I generate. I’m sure this list is missing many pieces, but even this list reminds me just how much information is being collected about me:

Phone and computer apps:

  • Spotify
  • Uber
  • WhatsApp
  • iMessage
  • Instagram
  • Facebook
  • Amazon
  • Google Suite
  • Outlook

Data from In-Person (or telephone) interactions:

  • Insurance Company
  • Doctor’s office
  • Samsung – service call
  • Restaurant order

Data from routine movements:

  • Thermostats (this goes to our utilities company)
  • Commuting on the T (MBTA gets this data)
  • Paycheck deposits (goes to both my bank and my employer)

How is My Data Being Collected Everyday?

  • Using my phone in the morning for calling and texting. Cell phone companies and Apple collects this data.


  • Health activity that is tracked by my phone, such as number of steps, floors climbed, and distance travelled


  • Riding past the bicycle counter in downtown Cambridge


  • Social media accounts: Facebook, Snapchat, etc. These accounts capture numerous different types of data about myself and my friends.


  • iMessage and WhatsApp throughout the day. These messages are sent to family, friends, and significant others.


  • Entering and exiting the gym using the scanners they have. This serves as a tracker of my location.


  • Exercise data from Suunto watch: swimming and running distance can be tracked by this watch.


  • Scanning in with my student ID at the Operations Research Center. This shows when I enter the center each day to work.


  • Use of my computer to access the internet, to send emails, buy goods, and submit school assignments


  • Using GPS to go from one location to the next. GPS is used on my phone and watch to track my location.


  • Using Uber or Lyft as a means of transportation.


  • Credit card and debit card transactions at restaurants. This can serve as a measure of how much you’re eating out.


  • Sending money to friends for groceries, food, and gas. USAA keeps tracks of how much money I send to various places.


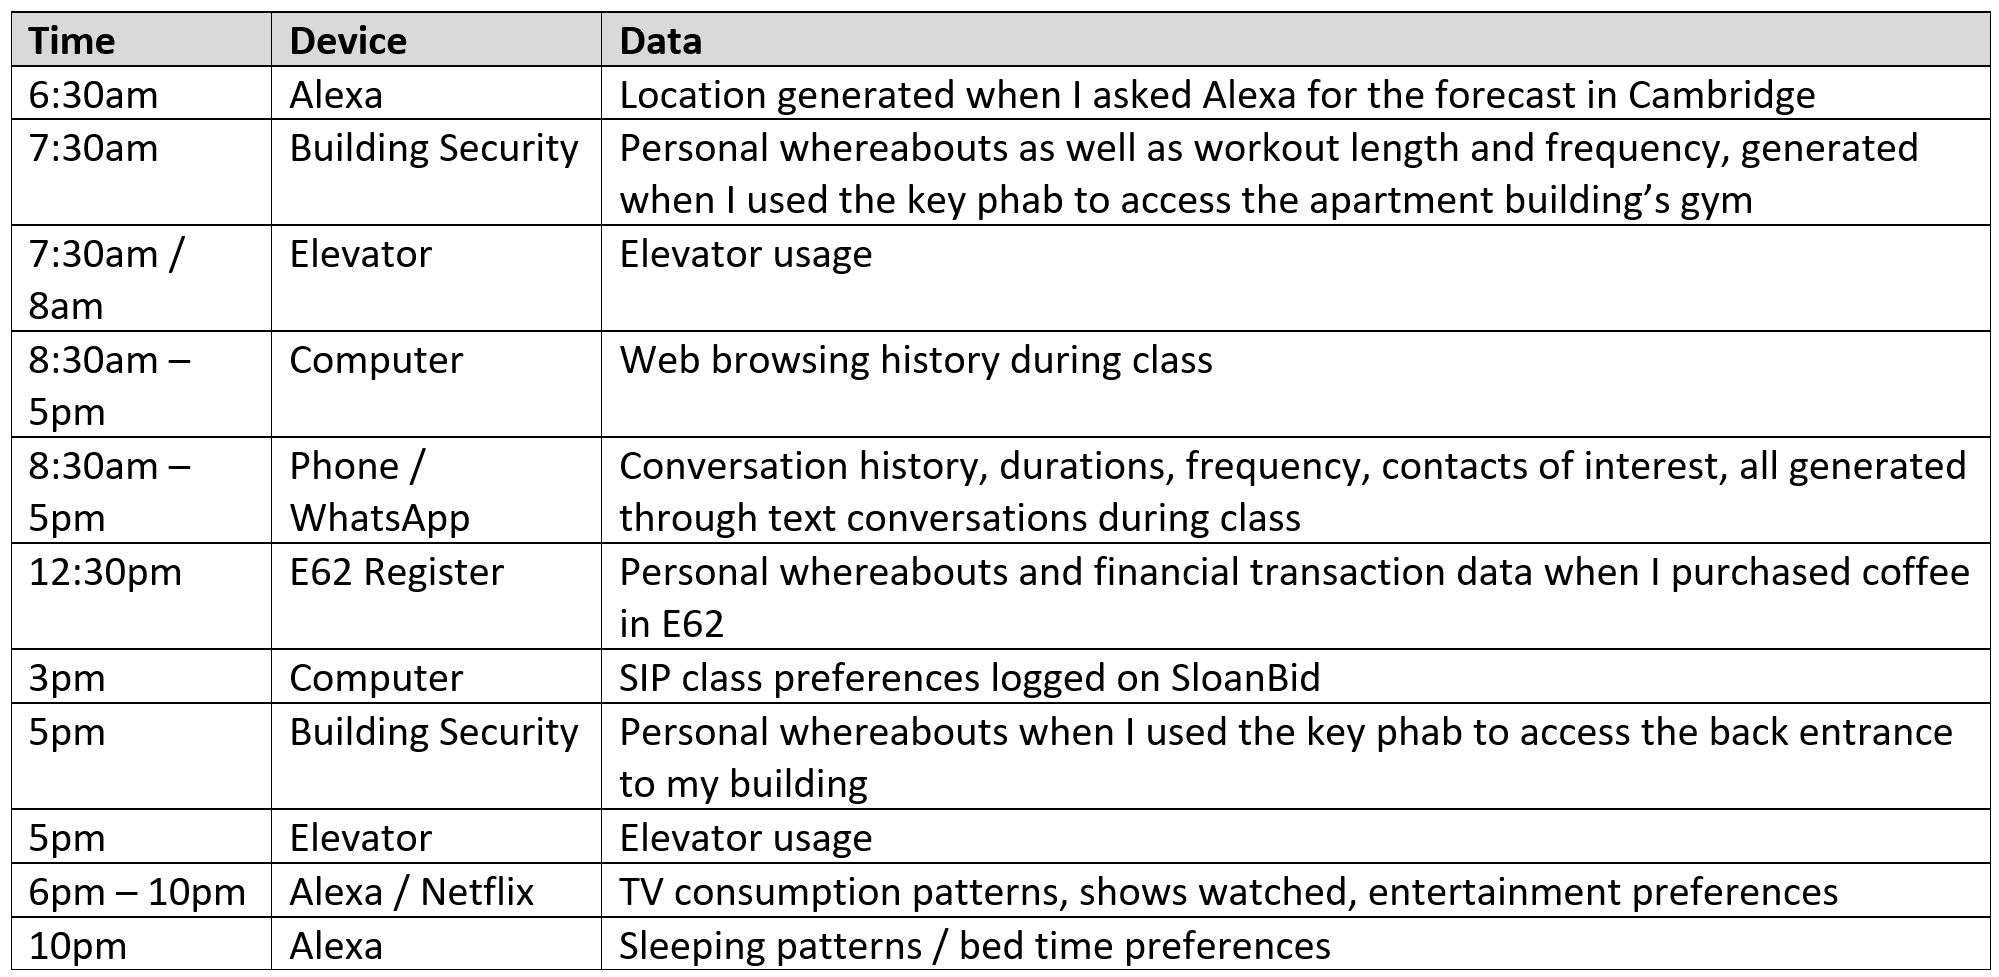
2/25 Data Log

On February 25th, I attempted to record the data my daily routine generated and captured it in the table below.  I learned from this process that aside from the usual suspects of phone and computer data generation, I was generating a significant amount of data from my building security system and from my Alexa smart home device.