Foodio Kart

Foodio Kart is an Interactive racing game that helps middle schoolers to learn about how they can make healthy food choices to fuel them and make them thrive in life. The game was built using Scratch.

Victoria Palacin, Rubez Chong, Wataru Doita, Sarah Von Anh

Audience: 21 kids at a local school in Boston, age 8-10

Methodology:

Selected datasets: We combined data from two datasets in order to create a list of food items that could be converted into game elements:

  1. Nutrition data. Scores of protein and carbs are based on standardized numbers among the choices
  2. Health score comes from the data of EWG, which are scored by the levels of concerns about nutrition, ingredient and processing

From data to game dynamics:

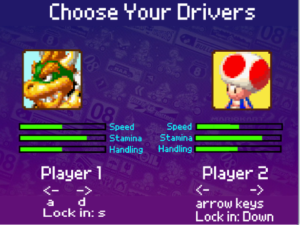
Racers: In the game different characters have different skills (stamina, speed and handling). These skills are intentionally made differently to help kids understand that everyone’s food needs can be different.

  • Light Weight: Yoshi, Toad, Peach
  • Heavy Weight: Bowser, DK, Wario

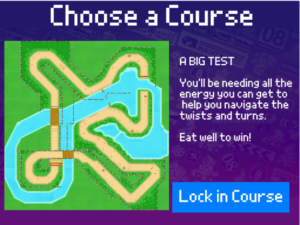
Courses/Routes: In the game, there are 3 courses/routes that the player can choose to play. Each one has a different theme (field day, mind & mood and a big test day ). The courses are grouped into themes to show that different activities can require different nutritional needs and to kids an opportunity to learn food can affect both physical and mental activities.

  • Test today: technical
  • Field day: fast
  • Mood related: sugar crashes

Foods: In the game, food items serve as a fuel with different properties on the game. Table 1 shows the these effects. Players pick their favorite 3 snacks from 9 choices. The snacks a player picked appear on their course. Some of the principles behind the choice of these effects are:

  • Max speed: affected by proteins
  • Handling / focus: affected by fruit/veggies, healthy fats
  • Acceleration / stamina: affected by grains
  • Power ups: Vitamins and whole grains

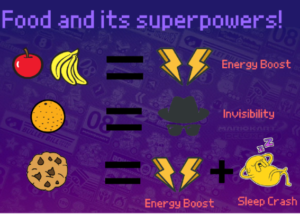
Table 1: Food and their effects on game dynamics

Food Value: Protein Value: Carbohydrate Value: Health Score* Game Mechanic: Effect
Apple 1 4 5 Boost speed 4 sec
Banana 1 5 5 Boost speed 5 sec
Orange 1 3 5 Make invisible / force field so can pass through cookie
Mixed Nuts 5 2 4 Make smaller so more agile 4 sec
String cheese 5 1 3 Turbo boost to end
Gogurt 2 2 4 Make slower 3 sec
Chocolate Chip Cookie 1 3 2 Boost speed 2 sec sleep 3 sec
Potato Chips 3 4 3 Make bigger 5 sec
Crackers 2 2 3 NOTHING
Bagel, plain 3 4 4 Boost speed a little but for 10 sec

*Median score in the category here: https://www.ewg.org/foodscores

Impact and Evaluation of Data Game

The key goal of Foodio Kart was to educate middle-schoolers on nutritional health and the impacts of different foods on their body. Nutritional data can seem dry and boring; Kids have also heard the same song sung many times. Thus, we wanted to find a new spin on nutritional data by building an interactive game to get kids to “experience” the tangible impacts of different foods on their body via their Mario Kart characters.

Semi-structured questionnaires:

Questions to audience pre-story:

  • Have you ever played Mario Kart?
    • What do you like about it?
  • What is your favorite game?
  • Explain why are we here today and our goals
    • Introduce ourselves
    • Raise your hand if you have questions

Questions to audience post-story:

  • How did you like the game?
    • Was it easy and fun?
  • What was this game about?
    • What do you conclude from this game?
  • What did you like from the game?
  • What would like to change in this game?
    • What other types of features you imagine on this game?

How the game works: Kids take on Mario Kart characters and aim to complete a race course. However, the course is littered with all kinds of treats i.e. cookies, chips, apples, oranges, bagels, string cheese. Kids are instructed to eat well as it is their big race day! As they race through the track and pick up these foods, they experience the immediate impacts of the food i.e. cookie – an initial sugar rush and speed boost followed by an energy crash where the characters are forced to take naps, as the other racers speed by. This is an example of how we tried to incorporate tangible impacts of food (via the food nutrition data we analysed) into the game.

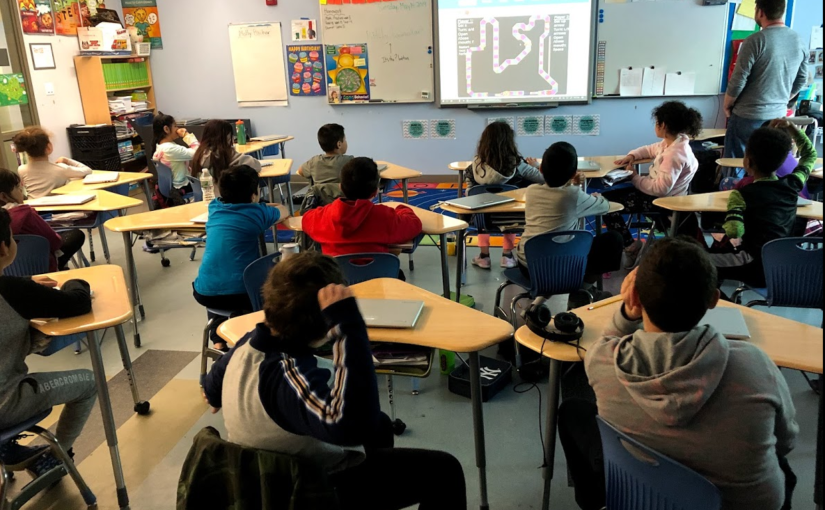
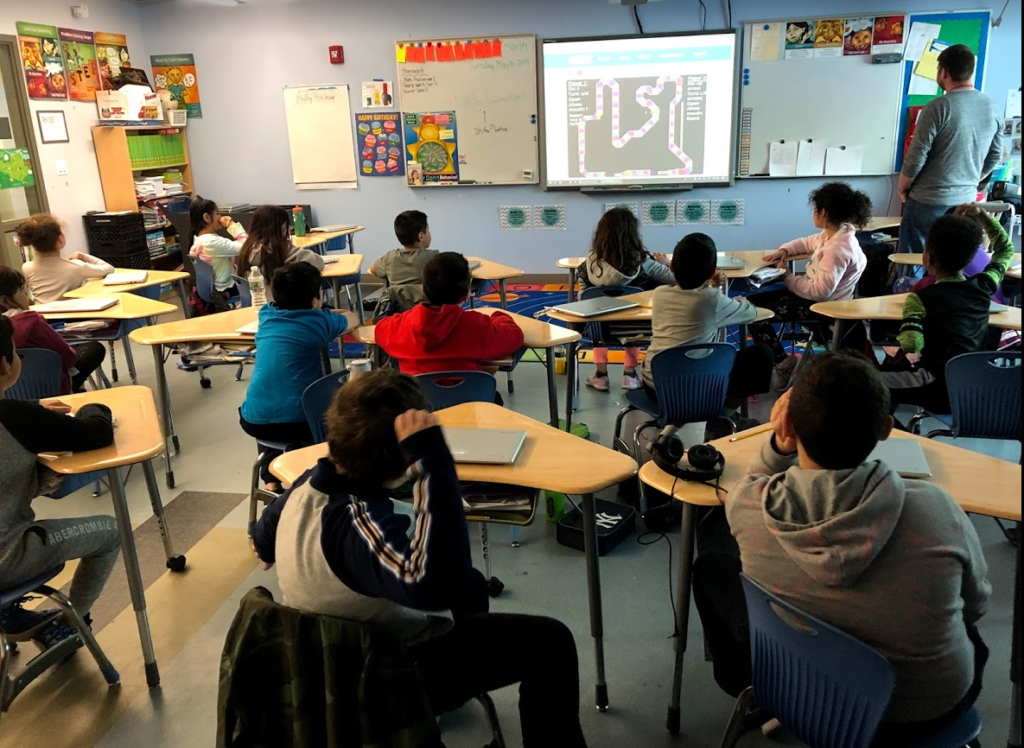
Context for testing: We built the Foodio Kart game in Scratch and brought it for testing at East Somerville Middle School. We had an hour with 21 third-graders where they played the game and the session culminated with a conversation about nutritional health using their takeaways from the game. We also used this time for gathering their feedback on the game i.e. things they liked/didn’t liked/would like to see in the future.

Evaluation

Things that went well: 
The kids were really excited about the game and understood the importance of eating well and the impacts of different kinds of food on their bodies. The game provided strong context for diving into a meaningful conversation on food and health. We spent the last 20 mins discussing what it means to eat well and gathering feedback on the game.

Things that didn’t go as well:
We overlooked the logistical challenges that come with working with kids in a school. Firstly, we couldn’t get access to the school’s private wifi and secondly, we didn’t expect each kid to have their own chromebooks (!) We had intended to set up 2 play-stations with 4 kids playing at any one time, as the game was designed as a 2-player experience. This made close observation harder than expected – we were constantly shuttling between the 21 kids.

Further, the game was glitchy and buggy as all 21 kids were playing the game at once. This, in part, took away from the experience of the game. However, all of the kids managed to play the game once and learned about the impacts of different snacks on their “performance.”

Things we would’ve wanted to change:
Whilst we had a meaningful conversation with the kids on nutritional health, it would’ve been better if we could’ve gone beyond the general nutritional discourse on healthy vs. unhealthy food to a more nuanced breakdown of the kinds of nutrition in food, their impacts on health, and a hierarchy of foods – i.e. not all foods are equal – banana vs. apple; though both fruits, affects the body in different ways. We could’ve backed this up with the nutritional data we analysed.

Further, our conversation with the kids helped us realise that it would’ve been helpful to include nutritional/food data as pop-ups in the game to further explain the impacts of food on their character i.e. why the sugar rush and energy crash after eating the cookie.

Feedback and Interview with Kids:

We opened the conversations by getting the kids to tell us their likes/dislikes of the game. To our surprise, the kids were honest and gave us valuable feedback. Many found the graphics and the characters too small. Some expressed that it was different to navigate through the course and some buttons didn’t work for the kids. Some also shared that it would’ve been more impactful if the game was designed from the 1st person viewing angle rather than the 3rd. Finally, the soundtrack was a big hit amongst the kids!

Common causes of colony collapse for hobbyists

Team Member Names: Lily Xie, Melinda Salaman, Sarah Caso, Victoria Palacin

Data source: Honey Bee Colonies, Released August 1, 2018, by the National Agricultural Statistics Service (NASS), Agricultural Statistics Board, United States Department of Agriculture (USDA).

Summary: The data say that for small-scale bee farms (5 colonies or less), the colony loss rate is more than double during the winter months compared to the rest of the year. We want to tell this story because, while varroa mites are the biggest health stressors for small and large farms, they disproportionately affect large bee farms and therefore many sources warn beekeepers about mites as the most important stressor to watch out for. We noticed that small-scale beekeepers could save a lot of colonies if they were more prepared for winter, even though the USDA does not list it as a major health stressor in the report.

Audience: Our audience is comprised of small-scale, hobbyist beekeepers that are just getting started with farming bees. They have just purchased a beekeeping kit or joined the “Backyard Beekeepers Association.” They may have done some research about the obstacles to taking care of bee colonies, but are most likely only minimally informed. They also might have seen statistics for large-scale bee farmers and be worried about the wrong health stressors.

Data: Our data source (“Honey Bee Colonies”) is a multi-year report around colony loss in America published by NASS from USDA. This data source contains two pages of insights presented in an executive summary format, as well as a series of charts. The first six charts are full of information about the number of colonies lost, added, or renovated on large-scale bee farms, which they define as having five or more colonies. This data is disaggregated by quarter over 2017 and 2018 (January – March, April – June, etc.) as well as by U.S. state.The next set of charts outlines colony health stressors for large-scale bee farms in the United States, again disaggregated by quarter over 2017 and 2018, as well as by U.S. state. Finally, there was data on the number of colonies lost to Colony Collapse Disorder (CCD) on large-scale bee farms in the U.S., broken out by quarter in 2017 and 2018. At the end of the report, the same information is shared about small-scale bee farms (with inventory of less than five colonies), though this is not as disaggregated as it was for the larger farms, and typically presented as annual figures.

We did not consider the quarterly or location-based disaggregated data as useful for our target audience, and therefore looked at these figures primarily as annual aggregates.

To tell our story effectively, we wanted to present 3 pieces of information:

  1. Scale of colony loss: We start our story by illustrating how many colonies were lost in 2017. While we assume some prior knowledge about loss/CCD, many hobbyists might not know the national scale of the issue. We present the data in a creative chart format that compares the weight of total bees lost to CCD to the weight of nearly 200 African elephants, giving the reader a sense that this is a significant loss of bees worthy of paying attention to. We present this data to show that colony loss is an important problem, and that the viewer should keep reading. 
  2. Common causes of CCD: The foundation of our story is based around the shared understanding of mites, parasites and pests as the major causes of colony loss. In order to start breaking down this assumption, we show the different distributions of large-scale and small-scale stressors. The stressors are presented with stacked creative charts because we want to alert hobbyist beekeepers that the risks they may have read about on the internet for large-scale farms are not quite the same for small-scale farms. Our data shows that mites and pests disproportionately affect large-scale farms compared to small-scale.
  3. Seasonality of colony loss for small-scale farms: Our story concludes by highlighting winter as an important cause of colony loss that affects hobbyists but not larger farms. We show the seasonality trends of small vs large farms as a line chart, in order to illustrate continuous trends over time. Our data shows that small-scale farms observe spikes in colony loss during the colder months of January through March, while large-scale farms do not seem to have any seasonality in loss trends.

Format: We decided to make a small pamphlet to describe popular causes of colony loss and redirect readers’ attentions to risks posed by cold weather. Pamphlets are already commonly used for guides and “how-to” literature, so we wanted to present our “Common causes of colony collapse for hobbyists” in a format that matched readers’ expectations. The pamphlet opens up into a 8.5×11 sized poster that shows the impact of winter on small-scale farms and also includes a feeding log that farmers can use to keep track of their winter food supply. We chose to incorporate a reveal into our format because the narrative of our story follows a “setting it up and knocking it down” arc. We use the inner pages of the pamphlet to set up the expectations around common culprits of colony collapse, then use the transition into the poster to involve reader in an “aha” moment and reinforce our narrative with physical action. Our poster also includes a blank log for tracking feeding in order to add some utility to the product. We hope that beekeepers can hang up this poster in their house to serve as a reminder to check in on their bees during the winter and keep track of when the colonies were last fed.

A Monday data log

During this Monday, I stayed home and completed an online certification, hence it was not a regular day where I would normally interact more with my surroundings. Below a data log of my Monday:

  • Waking up alarm
  • Emails received/sent
  • Records of played videos/music on youtube
  • Personal messages sent/received (whatsapp, facebook messenger, telegram)
  • App engagement (Facebook, Twitter)
  • Notes on Google Keep
  • Records of sports
  • Records walking distances
  • Bank records (Mobile)
  • Registration to events (Eventbrite)
  • Internet browsing
  • Calendar activities
  • Weather reports
  • Music requests to Alexa
  • Course tasks (submitted tasks, completion of online modules, etc)
  • Duo authentication records
  • Camera records
  • Postal service records of usage
  • Records of News read/browsed through
  • Blogging record

Journalist Death Records: A Global Overview

This interactive graph by Soha Elghany portrays the death records from the  CPJ (Committee to Protect Journalists). The visualization shows the number of journalists who have died around the world, it uses blue to represent past deaths and red for recent ones. It is also possible to interact with each of the spirals and explore every data point as a story.

The visualization’s goal is to provide an overview of a global problem and let the reader explore it story by story. In my opinion, the main audiences for this work are researchers and the general public. Because the focus is put into navigating stories rather than stats and predictions.

The visualization does a good job getting its core message through as in “journalists are being oppressed worldwide”.  Also, having the data points represented as spirals helps to understand the scale of the problem. However, each data point in the spiral is not the same, while for some countries a data point represents 2 deaths for others it can represent dozens. Also, there is no consistent datapoint sizing, in some cases, 49 deaths can be 4 data points whereas in others they are represented by 2 or 3 data points. From a reader perspective, the choice of font type and size is not ideal, it makes the visualization harder to read. In addition, the choice of colors does not enhance the reading experience. Regional filtering/grouping would have been very insightful to have in this viz.

Link to the data viz