The Great British Buffet: 1974 vs. Now

Team Member Names: Melinda Salaman, Ayush Chakravarty, Kate Soule, and Michael Rieker

Audience of the story: focusing on small farmers growing several key food types, such as potatoes, vegetables, etc. Our audience can also be considered to be members of the general public who are interested in learning about different food practices.

Our goal:  educate farmers at a farmers market about the trends in consumption of different key food groups. While overall consumption of produce (writ large) has remained relatively constant in the UK, some categories are faring better (increasing) than others (decreasing). We want farmers to understand where their category lies and walk away with concrete ideas on how to improve or maintain their position.

Who we are in the story: organizing body (of some sort) advocating for farmers’ best interest.

Context of the story: we are presenting a display at a farmer’s market in the United Kingdom. We hope to educate people on food growth, use, and consumption.


The Sketch:

The story we want to tell is that while farmers’ produce has stayed at a relatively level percentage of the UK’s overall consumption (hovering around 50% from 1974 – 2014), there are certain key types of produce that have seen a dramatic decline. We want to draw attention to those groups. We’ll do this through an interactive display: a large tray of food representing each of the different food groups we call out. Each piece of produce represents the consumption of that food type in a particular year.


This interactive display will have farmers participating in telling the story of key groups of produce in the UK. This will be a four stage process in which participants will assess their own ideas about how food consumption has changed in the UK over the past four decades (1974-2014).


  • Stage #1: Show the weekly proportion (in grams) of fruit, vegetables, meat, and dairy consumed by people in the UK in 1979. This will be represented by an actual plate of food in front of the participant. The food will be labeled and these labels will have relevant statistics and graphics that help the small farmers to gain a better understanding of the story behind each food group.


  • Stage #2: Have an audience member construct a plate of food on their own using their understanding of what UK residents currently (2014) consume. In other words, we’ll ask the participants at the market to look at a tray of food with different groups of produce, pick up different pieces of produce, and compare consumption in the past to that of the present.


  • Stage #3: Reveal the actual current consumption of different food groups in the United Kingdom by using a third plate that has the correct proportion of food. This will help people to learn about what is actually occurring and how this may differ from their own understanding.  


  • Stage #4: Provide participating members with a pamphlet that helps them to learn more about how consumption patterns of the groups of produce have changed over time. The follow-up pamphlets will emphasize what they can do next: organize politically, increase farm productivity, and diversify crop yields.


We will go through these four stages during our class presentation to show how the idea would work in practice. We also considered weighting the items of food differently and using a scale to show how consumption had changed.

A very similar process could be undertaken with other types of food (such as industrial meat), but we are clearly focusing on produce for this sketch. An alternate idea would be carving the information into the food itself instead of using toothpicks and labels.

References:

http://britains-diet.labs.theodi.org


H2OMG – Do you want me to dump water on your head?

Team: Julie, Viki, Wataru

The data say that a lot of water is used to produce foods, while the amounts vary by crops, animals, and how foods are processed. We want to tell this story because we rarely have a chance to know this fact. We aim to let hungry goers aware that 1. huge amount of water is used to produce foods, 2. water footprint is different by foods and they can lower it by their food choices (less processed foods, more local foods, less meat and more veggies).

Our audience is people who come to a beach restaurant in California. We selected this audience and setting because we assume that they are so hungry that the restaurant can get their buy-in relatively easily by offering free food and also they would feel a good level of pleasure and stress about dumping water on them. We don’t want them to think the water dumping is either too pleasant nor too horrible so that they can take the learning about water footprint seriously but not unpleasantly through the experience. We believe our data sculpture is an effective way to tell the story because dumping should be a rare, memorable experience and also the restaurant setting allows the audience to see how different the water footprint of each food is. Providing a choice not to have the water dumped on them but to lean how to reduce their water footprint also works well to educate even people who don’t want to be damped.

The data we used is the water footprint data, in which you can see the amount of water used to produce each food is wide-ranging. Since the unit of the data is cubic meter, we broke it down into a per-serve basis and picked some foods which need a lot of water such as hamburger and vanilla and others which don’t like fresh pineapple. We also used the data of total water consumption among agriculture, domestic, and industry and showed them by labeling a pile of gallon water bottles.

Stamped Out: How income inequality affects food choices

Title: Stamped Out: How income inequality affects food choices

Team Members: Rubez Chong, Berlynn Bai, Philip Zhu, Nora Wu

Context: It’s Food Security Awareness Week at MIT. We’re students on campus who are trying to raise awareness on the impacts and consequences of food insecurity and inequity. We decided to put together an interactive data sculpture to get people to start thinking with their hands.

Audience: Our audience is MIT students

Summary: The data say that income inequality affects food choices in interesting and surprising ways. For example, “soft drinks” rank no. 1 for Supplemental Nutrition Assistance Program (SNAP) households and no. 2 for non-SNAP households i.e. not much of a difference at all despite the differences in income. We wanted to tell this story because we want the MIT public to breakdown and question the stereotypes about food choices by bringing to light the surprising similarities/differences in food rankings.

Our data sources come from the United States Department of Agriculture under the Nutrition Assistance Program Report in 2016. We use the data of the“Top Purchases by Expenditure for SNAP and Non‐SNAP Households” for this activity.

Why it’s appropriate: We wanted to visualize the diets of a SNAP vs. NON-SNAP and thought it would be compelling to do so with the use of a stomach sculpture. The styrofoam twirls are meant to represent different food items households purchase. It is effective in storytelling as the image of food items are vivid and the two identical stomachs help the audience empathize with the visceral impacts that income inequality has on our diet choices. The interactive “guess the rank” game highlights our perceived bias about these impacts.

References/dataset:

The Hidden Weight of Food

Group: Sarah Von Ahn, Amy Vogel, Theresa Machemer

The data say a lot of water is used to produce the food we eat.  We want to tell this story because we don’t often think about the resources used to produce our food. We want to educate interested museum-goers, so that they can (a) make more informed consumer decisions to lower their water footprint and (b) learn about the ways that water is used to produce food.

Our audience is members of the public who visit science museums (e.g. families or field trip groups), with the interactive display targeted at youth audience members age 10 and up, due to its height and weight. The pyramid display is accessible to all ages, as its appearance is striking, and the descriptive sign adds detail but doesn’t provide information that is crucial to the display. Science museum-goers are primed to learn and expect to walk up to displays and interact with them, making them the ideal audience to experience every level of this project.

The data we used is the water footprint data, which detailed the water used to produce various food items. We used the global averages for each food because there is not a region that produces every food item, and we did not want to compare across regions, which would have introduced variables like differences in transportation, climate, and agriculture technology. We then picked foods that would encompass ‘one day of meals.’ In our sketch, we created the model for an orange, an apple, and a pasta dinner. A final product would include breakfast, lunch, a snack, and dinner. This ‘day of food’ provides the narrative structure for the display, as the meals of a day are familiar and provide a chronological order to interact with the sculpture.

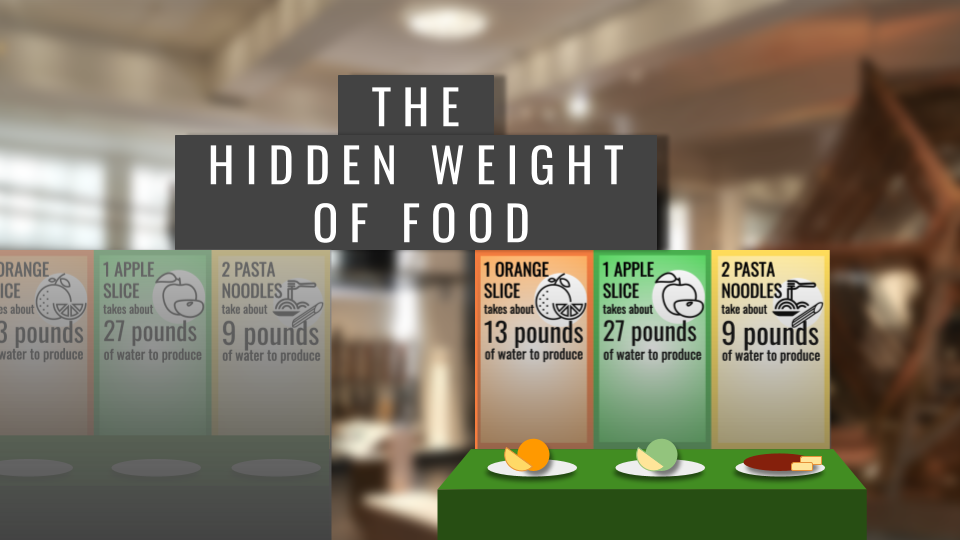
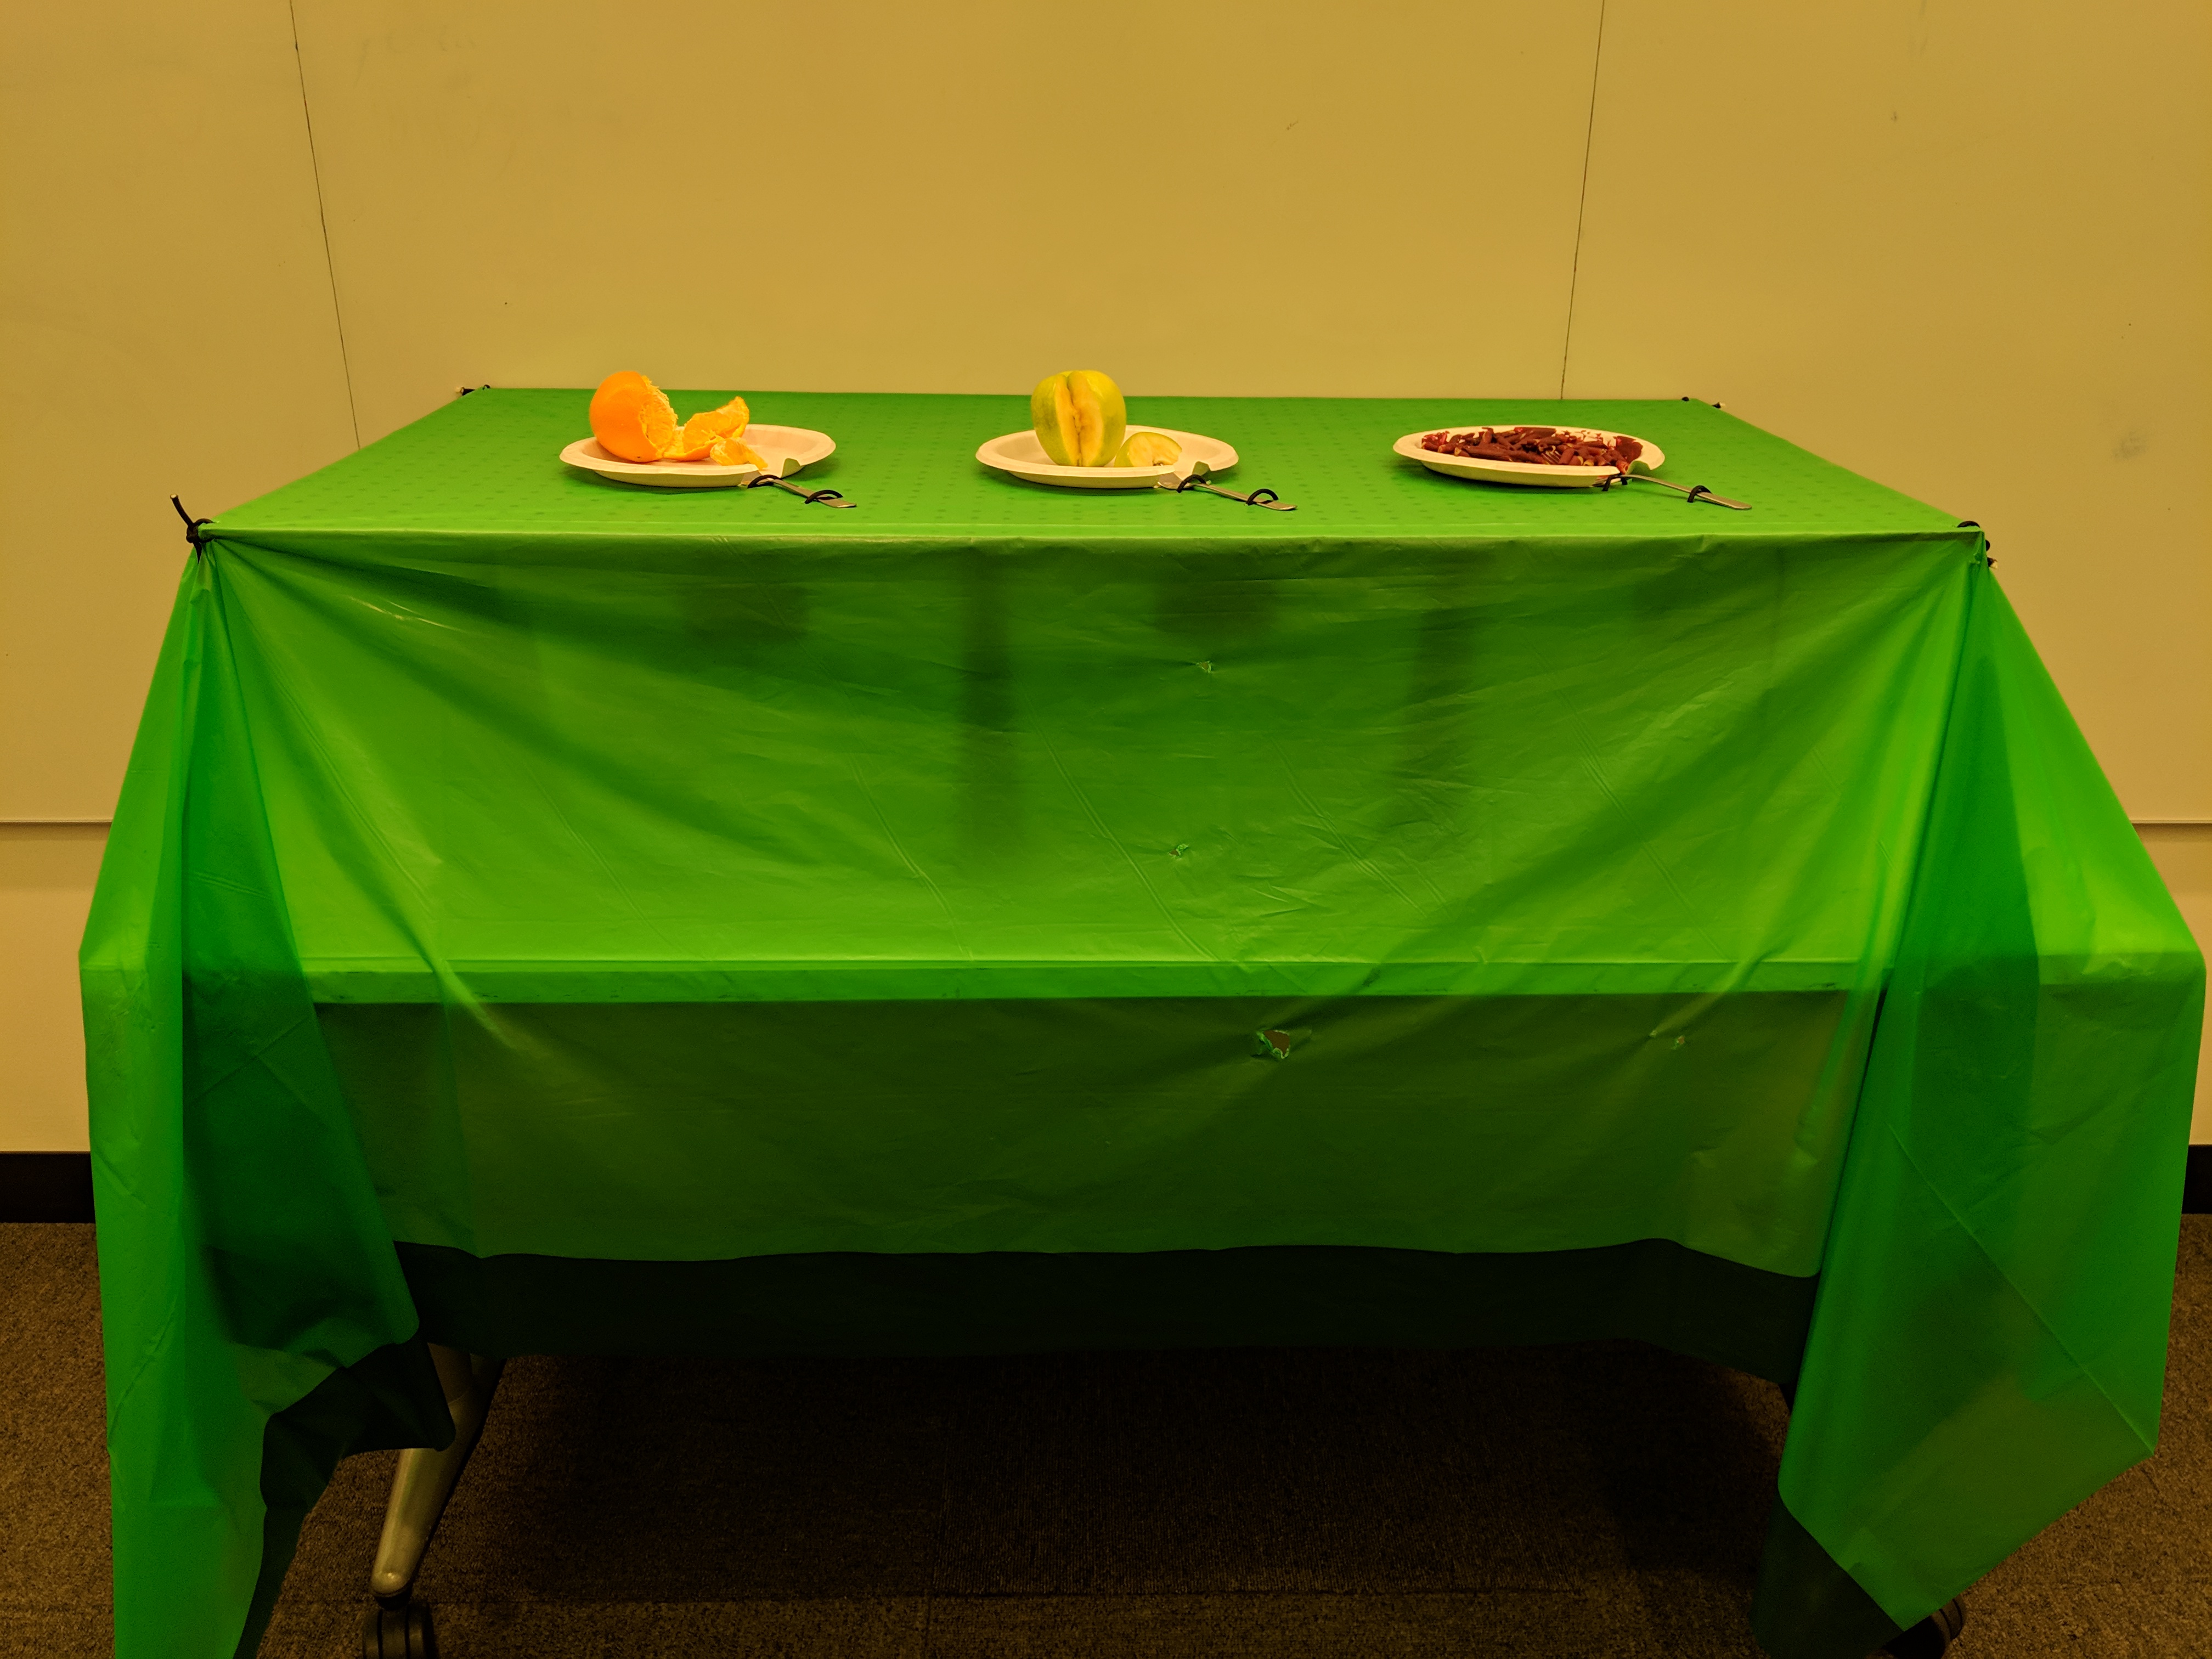
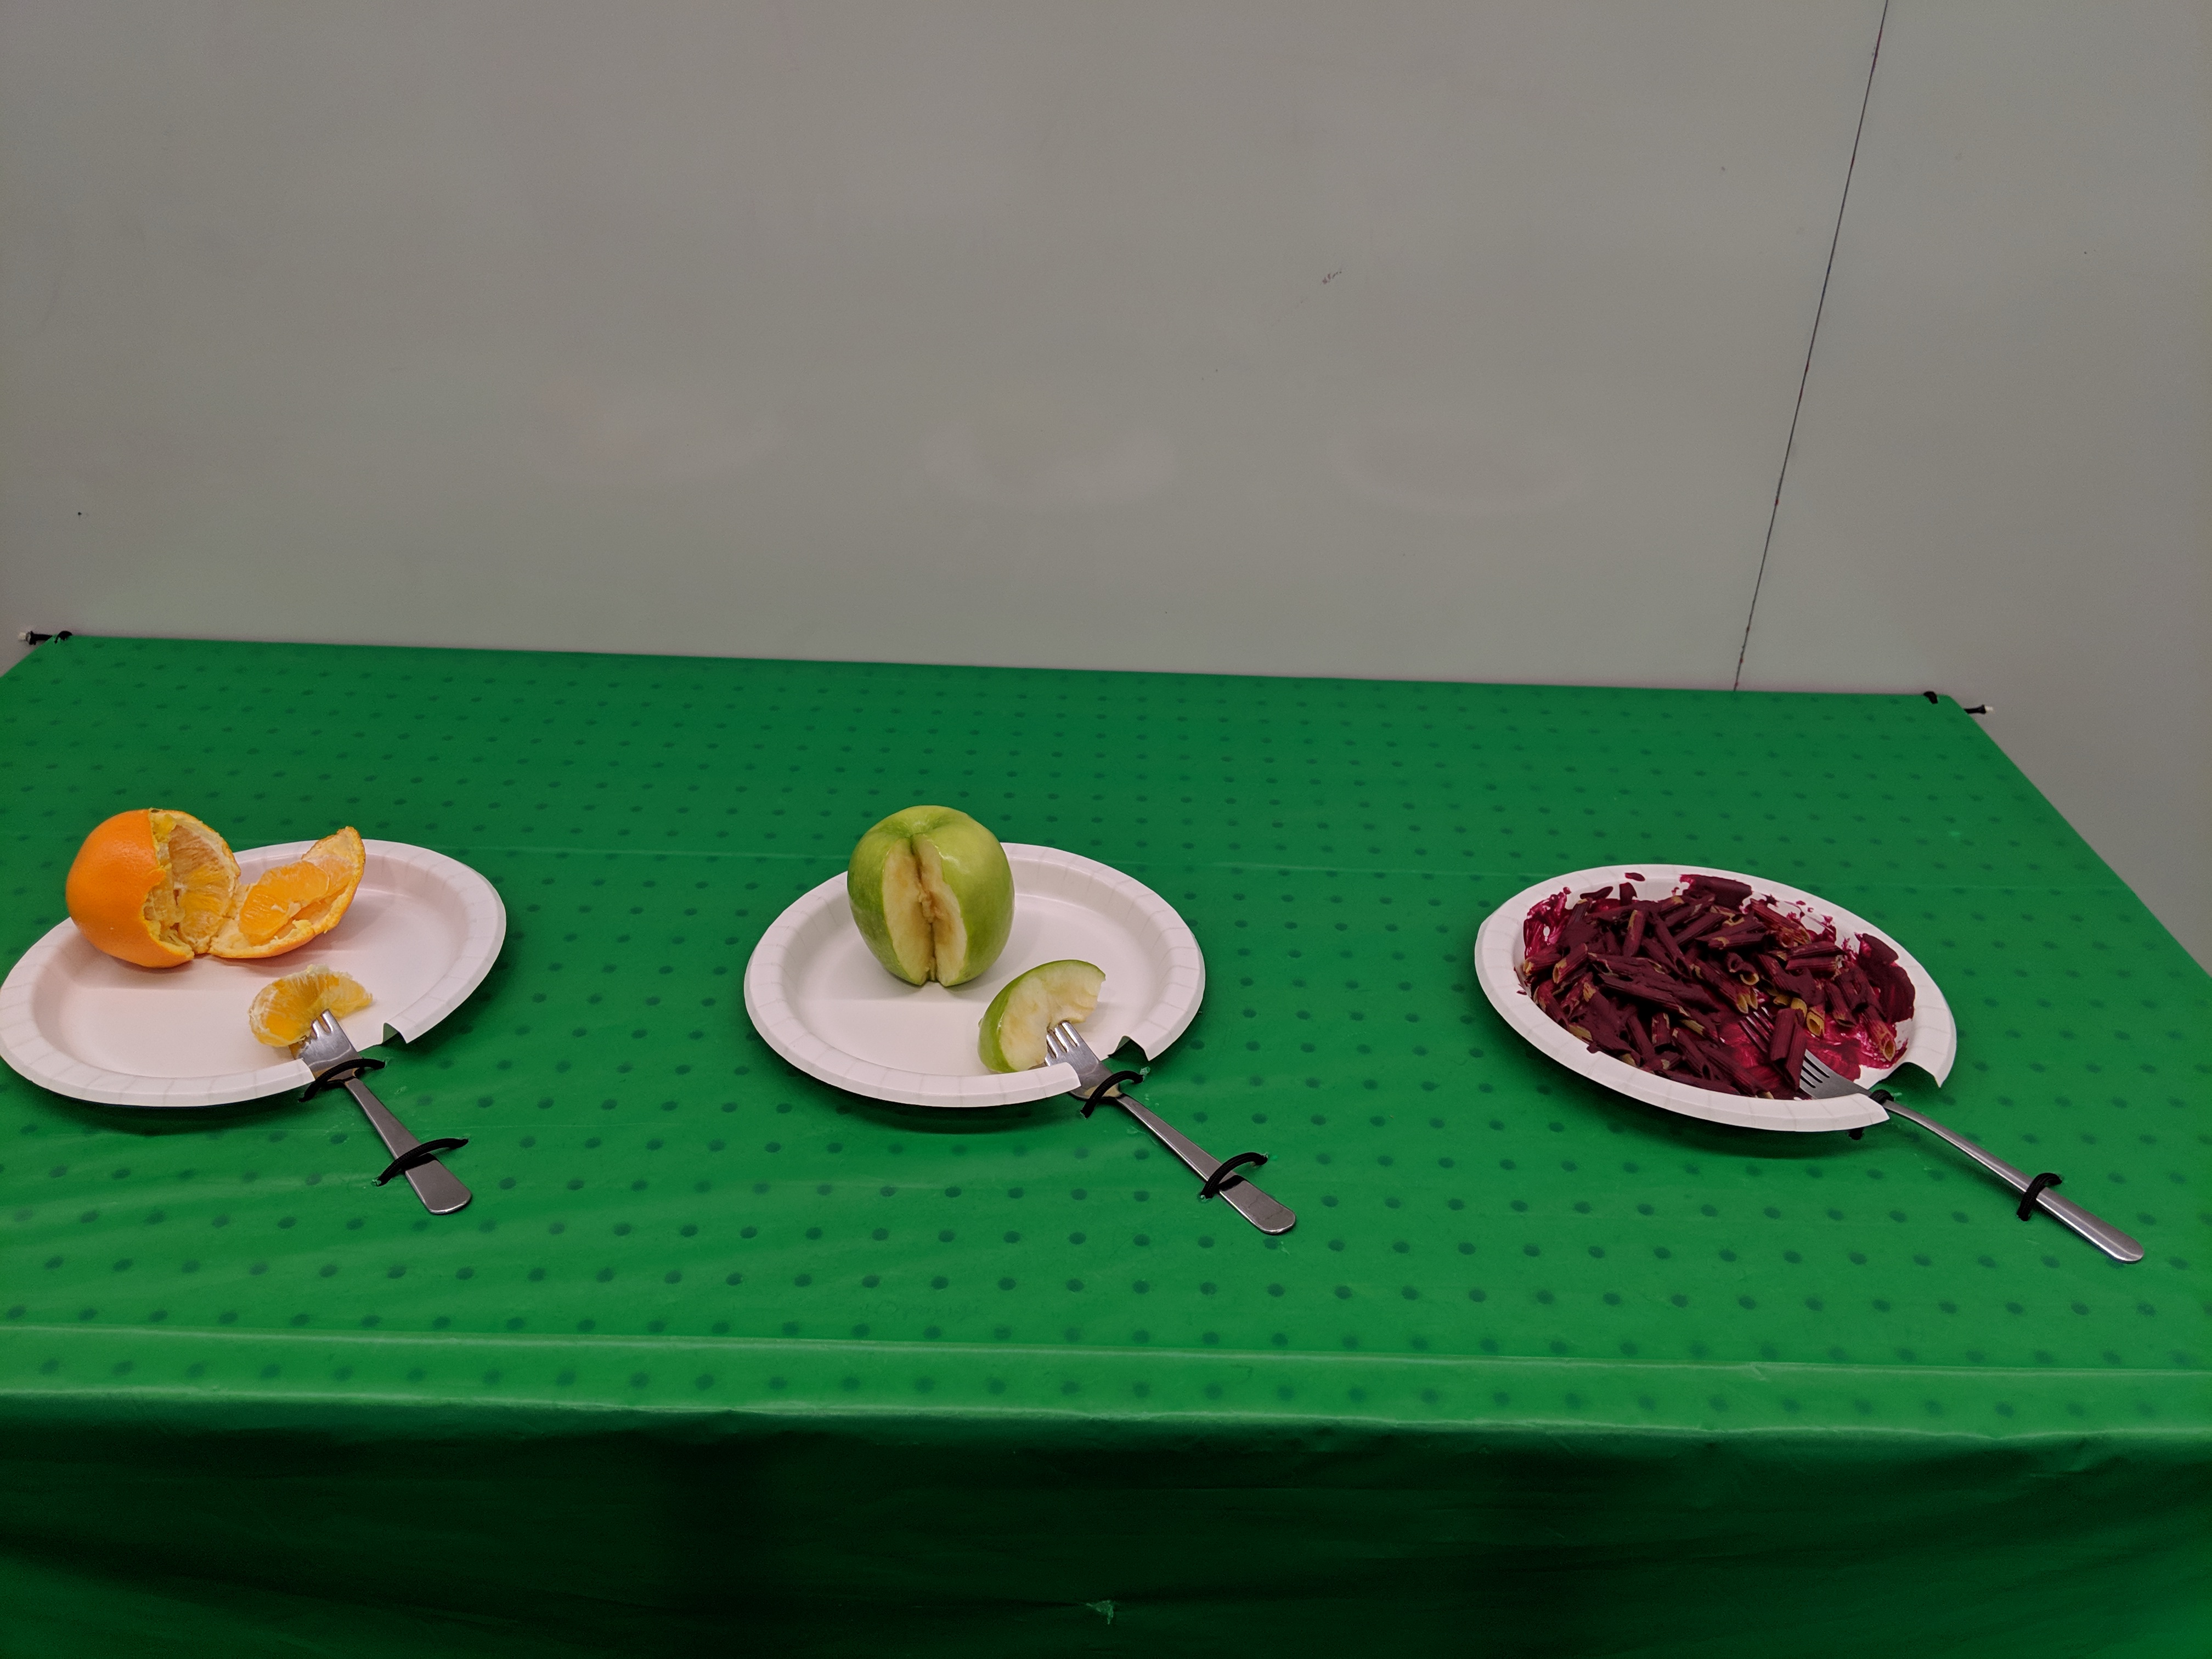
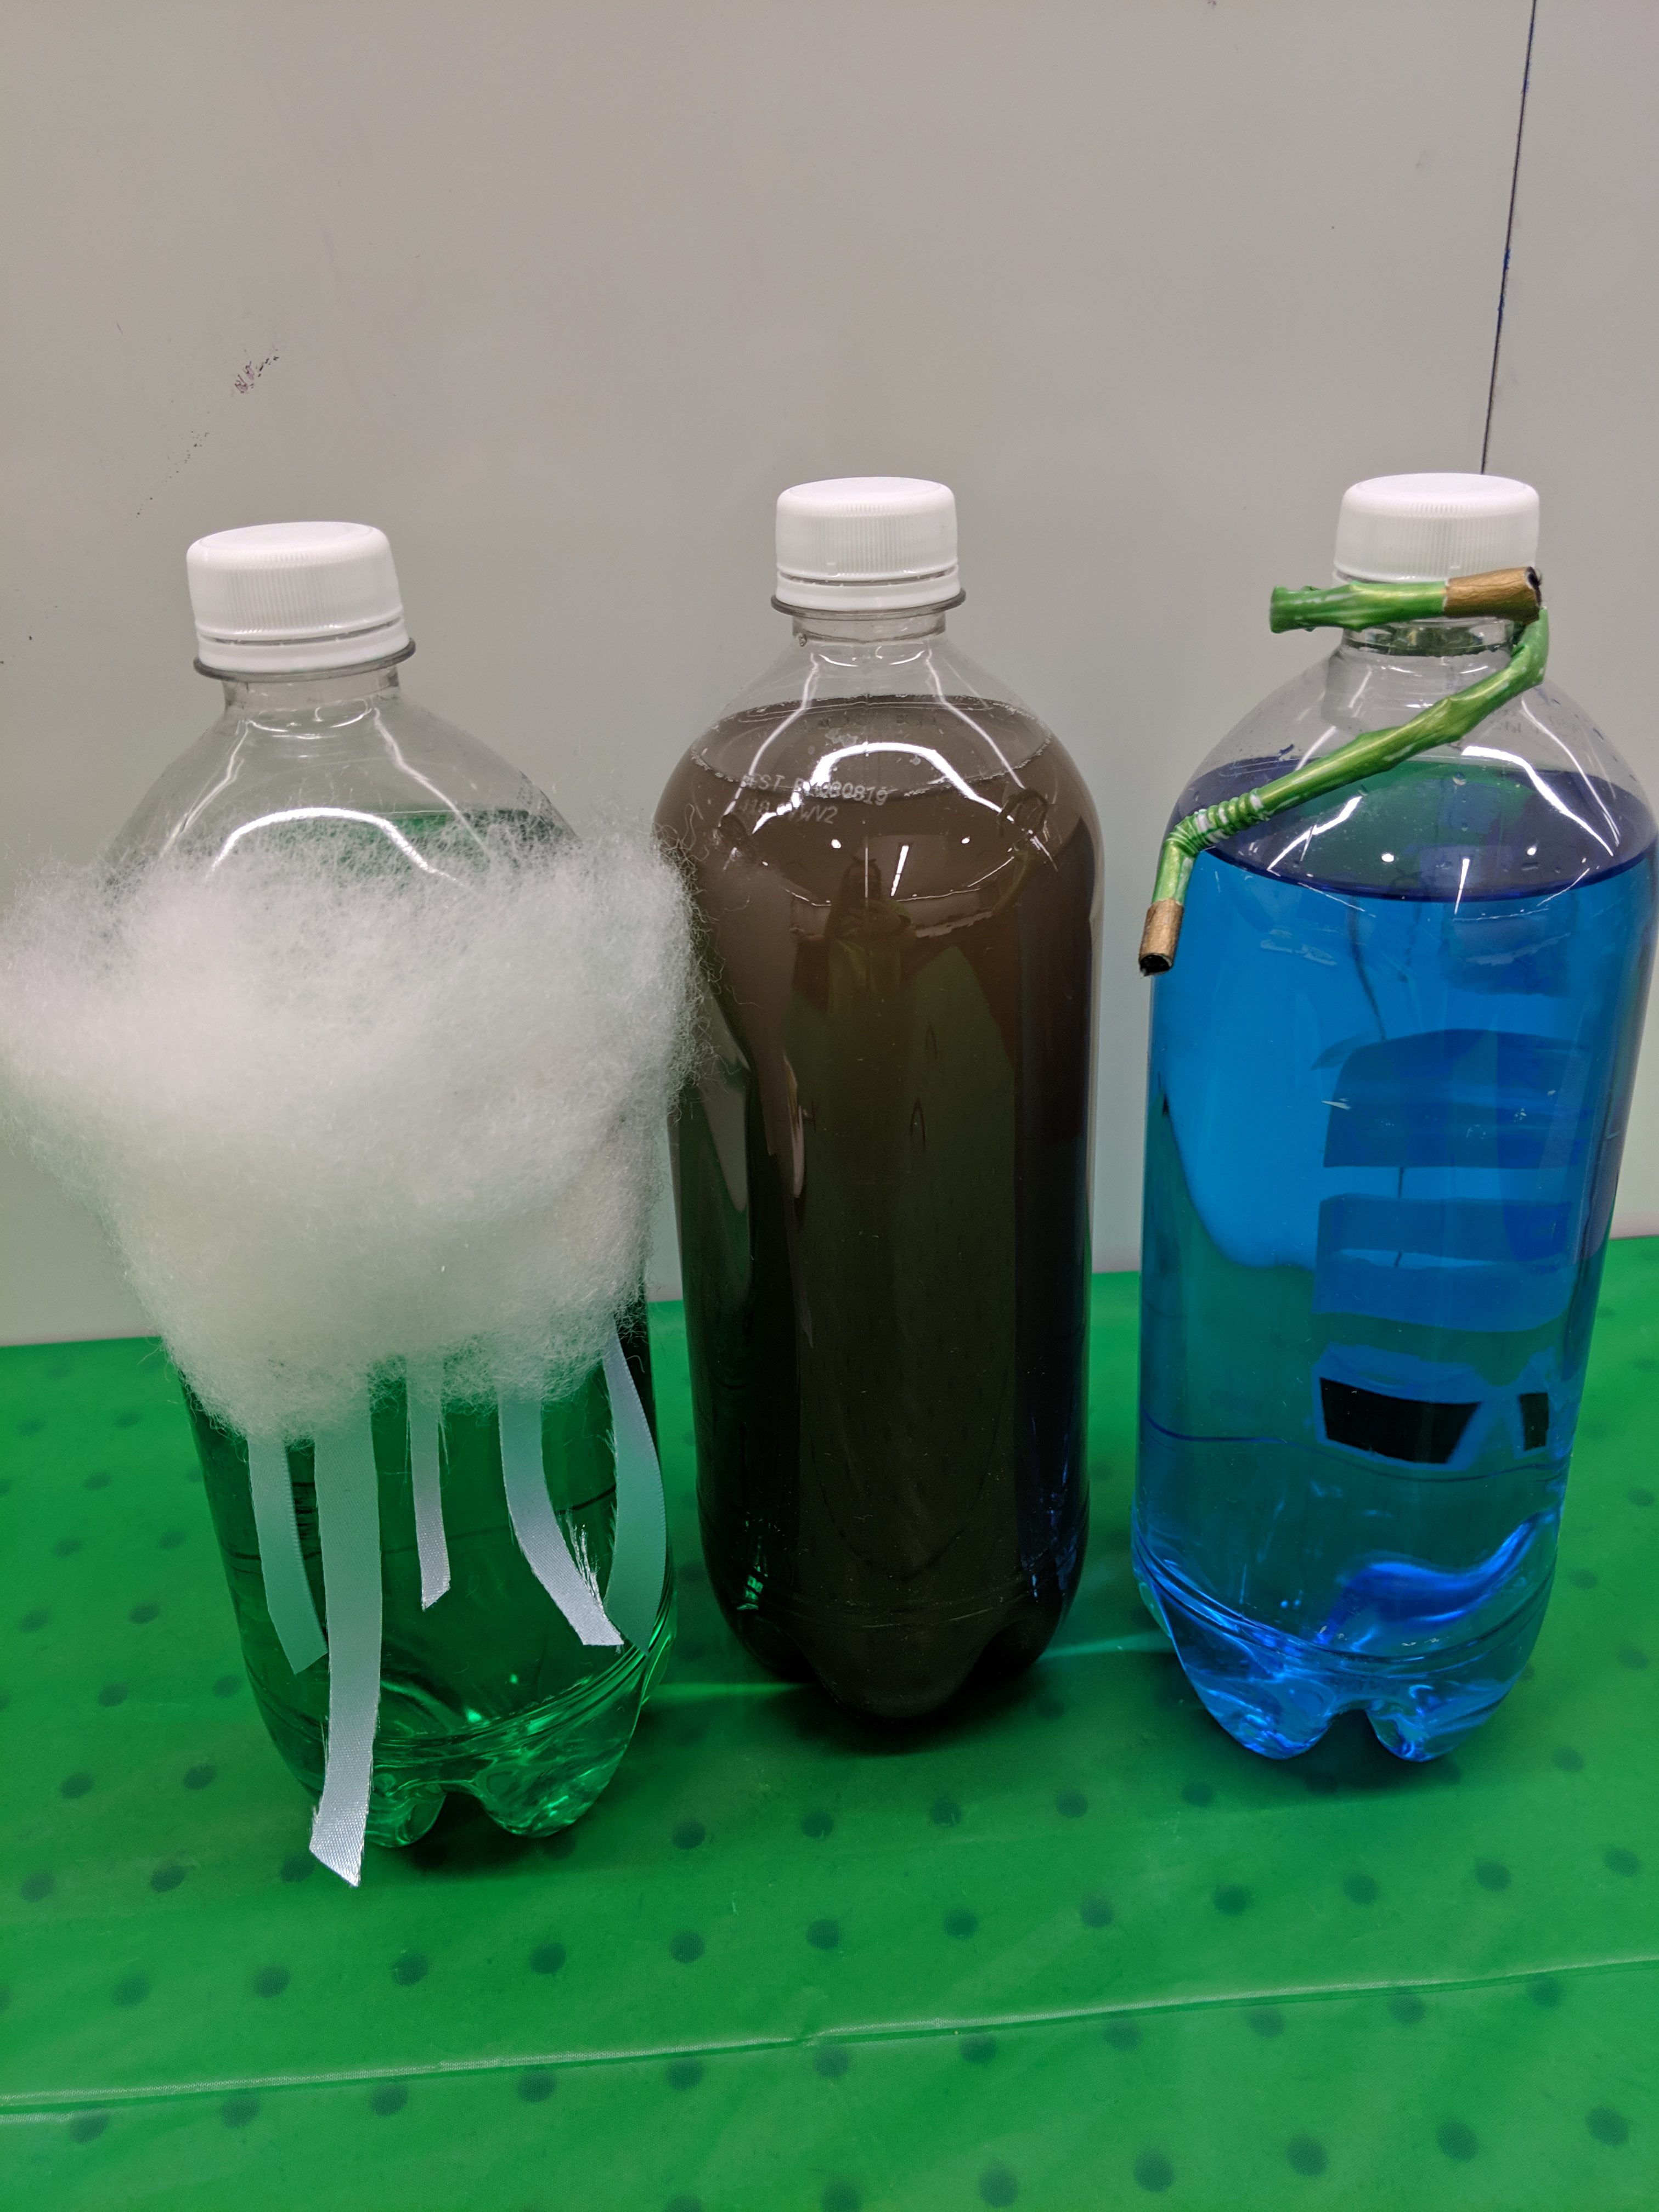
The sculpture, an exhibit in a U.S. science museum, is titled “The Hidden Weight of Food.” The hook is a long table with plates of food. Each plate has a fork with a bite-sized piece of food on it, such as a slice of apple. When you lift the fork, you realize it’s much heavier than a slice of apple should be. Upon being surprised and interested to learn more from the exhibit, you read the sign and realize that the weight you’re lifting is the weight of the water used to produce that bite of food. For a slice of apple, that’s a full 27 pounds. The museum-goer can then go through the many plates of food, compare weights of different food items, and think and read about why different foods require more or less water to produce.

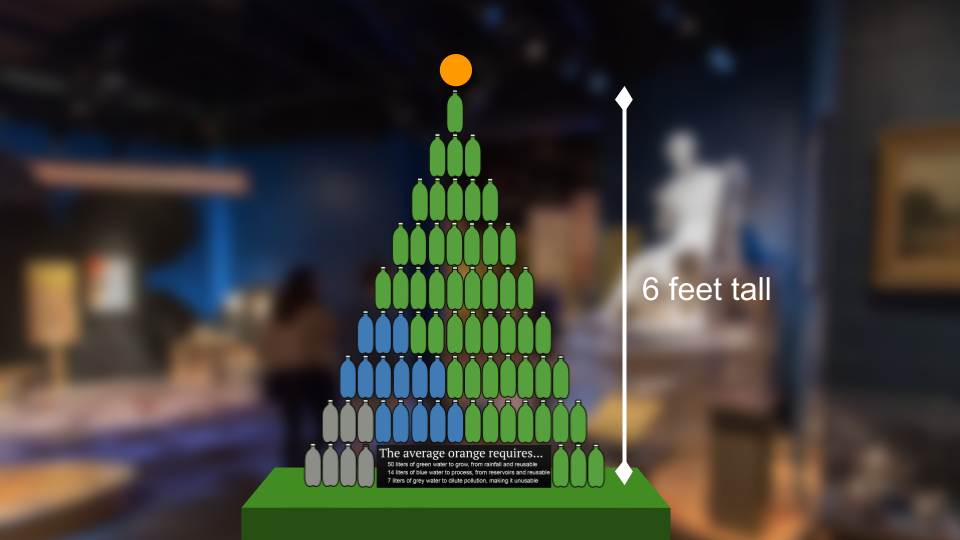
The table of weighted meals will have a path through it to a second section of the exhibit, which invites them to investigate further. The second section has pyramids of 1-liter bottles that are full of green, blue, and grey water, next to the foods they represent. For example, one orange requires, on average, 71 liters of water to produce, including 50 liters of green water (water from rainfall that is reusable after producing an orange), 14 liters of blue water (water from reservoirs like lakes and groundwater that is reusable after producing an orange), and 7 liters of grey water (water that becomes polluted while producing an orange, and is thus not reusable). This would be connected with information about water conservation.

The table of weighted food is effective because it pairs a familiar set-up (and thus expectations), food set out on a table, with a surprising result, the weight when you try to pick up the fork, that subverts the expectations. The title is an effective metaphor because the weights are literally hidden under the table and because the water used to produce food is invisible on the final food product. Without some data visualization, it’s impossible to tell how much water is used to produce your food.

Liter bottles in the pyramid are effective because they are familiar units, intuitive to read, that can visualize volume, which is normally difficult to conceptualize. Food coloring of the water in the blue and green water bottles and dirty water in the grey water bottles make clear from a distance the proportions of each type of water used to produce the food on display. Curiosity about the different kinds of water invites the viewer to come closer to the pyramid, where they would further understand the meaning of the different colors by the dirt in the grey water (pollution), the cloud on the green water (rainwater), and the hose on the blue water (irrigated water). If they were particularly interested, they could read the informational sign that goes with it.

Overall there are many levels to viewing the data sculpture from far away and up close, in both the first and second sections of the exhibit. Additionally, there is the metaphor of the weight of the water and the design of the liter bottles (color and accessories) to explain the types of water, and information to “go further” into kinds of water, water footprints, and food choices to reduce your water footprint.

Where is Your Water From?

By: Lily Xie, Sarah Caso, and Tanaya Srini

Our group worked with many of the tables provided in the Food Water Footprint report and eventually settled on using the “virtual water” data to demystify where our water comes from, and how much water we consume beyond typical household uses. The data say that only 5% of the water we consume on a daily basis in the US is related to household uses like drinking water, washing our clothes, and showering. Industrial uses account for 10%–double household use–of the water we consume, which was very surprising since we didn’t know what industrial uses actually included. We wanted to tell this story because we we wanted to correct misconceptions about water usage in the hopes of influencing how people think about their water consumption when trying to be more environmentally friendly.

Our audience are Boston Museum of Science visitors on World Water Day (March 22, 2019). We selected this audience for our demonstration because we wanted to deepen the knowledge of those with some preexisting engagement with science (i.e. visiting the Museum of Science on World Water Day). Our assumption is that these visitors would both be interested in learning about water and generally committed to environmental justice (given their celebration of World Water Day, a holiday created by the United Nations to further issues of water access). In crafting our sculpture/demonstration, we considered the all-ages audience we’d likely encounter at the Museum of Science and the way the audience would cycle through the museum, and concluded that we needed to utilize a more personal and interactive format to capture their attention initially and keep the demonstration concise to maintain our audience’s attention.
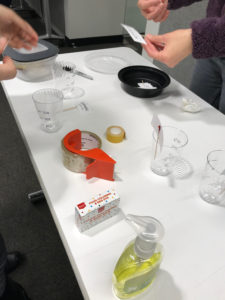
 

Caption: Setting up the demonstration 

Our sculpture and accompanying demonstration use water and cups (labeled with daily use, agricultural, and industrial) to invite visitors to guess how their water consumption is distributed across the three categories before revealing the actual distribution in pre-poured cups. Next, we introduce the idea that water shortages are a possible outcome of global climate change, to demonstrate the consequences such a shortage may have on one’s personal consumption. We do this by reducing the amount of water available for distribution, and asking visitors to make choices about how they would distribute their consumption under these conditions. The demonstration ends with an explanation of what the visitor’s new water consumption may change their life (i.e., less paper or cutting fresh produce in half).

We stick to household objects for our sculpture so that visitors feel comfortable interacting with the materials, and so that we can run multiple demonstrations at one time. We chose to discuss water shortages to challenge/broaden the visitor’s understanding of how their consumption may be affected. A water shortage would not just mean having to take shorter showers, but could also affect the kinds of foods we are able to eat, and how the material world around us looks and feels (in terms of industrial uses). The intent of the sculpture/demonstration aligns well with the goals of World Water Day and would slot in to the Museum of Science’s programming easily.


PROCESS

Our group never strayed from the Food Water Footprint data but abandoned a few ideas along the way. We crunched virtual water data that showed how much water countries imported and exported (disaggregated to green, blue, and gray water categories). We compared this data to global projections for drought severity, the Palmer Drought Severity Index to understand whether countries that were more or less susceptible to drought were also reliant on internal or external virtual water sources . We planned to do this by building lego blocks for each country to a height representing the share of the country’s total water usage that was imported. The color of the lego model represented the projection for drought severity on a color ramp from red (severely drought prone) to white (moderately drought prone) to blue (not drought prone). We then planned to pump water into a fish tank with selected countries, and lower the water level to simulate countries that would be left “high and dry” in the event of a water shortage. Unfortunately the message we were trying to deliver–about countries that were over-reliant on external water sources being particularly prone to drought– was not aligned with the visual approach: the countries more reliant on virtual water would be “revealed” by the falling water line first, but people tend to look at the emergence from water as a positive thing, since being submerged in water is associated with drowning. We also found it difficult to make the data land for our audience. It was difficult to personalize international water flows, and that message was taking precedence over our intent to explain the concept of “virtual water.” For these reason, we decided to return to our message and audience and try to simplify our sculpture to deliver a meaningful message about where their water comes from and how it is distributed.

MOCK DEMO SCRIPT

Welcome to the Museum of Science and thank you for attending our 2019 World Water Day event. Today we’re going to talk about where our water comes from.


Where do you think the water you use comes from?

(Audience answers: the tap, aquifers, rain)


All the answers you gave are correct – these sources contribute to domestic water – all the things you do at home: drinking, cooking, bathing, washing clothes and dishes, brushing your teeth, etc.


But there are actually OTHER ways we use water that do not fall into this category. What do you think these ways are?

(Audience answers: food, gardening)


[ Present the cups ]


In our day-to-day, we also consume water in the form of agriculture – such as the water it took to grow the vegetables we eat, or the water needed to feed livestock. We also consume water by ways of industrial products – for instance, the water it takes to make paper and plastic and even the clothes you wear.


[ Give everyone a cup full of water ]


Let’s say that this is how much water you use in a day. Go ahead and pour how much water you think you consume in each of these categories.


[ Reveal actual cups ]


Actually, 85% of the water we use is in the form of agriculture. 10% is in the form of industrial products, and only 5% of the water we consume daily is in the form of drinking or bathing.


[ Hand out marker ]

Now let’s draw a line around our cups to mark the current level of water use and pour the water back in our cup.


For many of us in Massachusetts, we are able to get enough water to live our day-to-day lives. However, not having enough water is a problem in much of the world, and will become an even bigger problem in the future. Due to growing population demands and climate change, scientists project that global water supply will only meet 40% of demand by 2050.


Let’s think about how your life might change if you only had access to 40 % of  the water you have today. Pour out half of your cup, and redistribute the water once more.

(Audience fills domestic cup 4%, industrial 5%, and agriculture only 31%)


It looks like you chose to fill up your agriculture cup roughly a third of the way.  Let’s see what the repercussions of this water shortage would look like.


[ demonstration ]


[Reveals the apple]

For every apple you eat today, you’ll only have access to ⅓ of the amount in the water shortage scenario.


[Reveals the soap]

For every container of soap you buy today, you’ll only have access to about ½ of this amount to wash your hands and dishes in the event of  a global water shortage.


[Reveals the water bottle]

Lastly, since you decided to keep your domestic water close to what it is today, you’ll still be able to access almost the same amount of drinking water, about enough to fill 80% of a water bottle for every water bottle you fill up today.