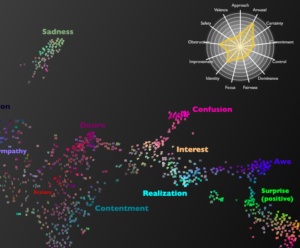
In a study released on February 5th, UC Berkeley scientists presented their statistical analysis of “vocal bursts”— wordless exclamations — in a cloud of colorful points organized by their emotional connotation. The webpage is interactive, so a viewer can hover the mouse over a point and the sound will play automatically. The scientists were able to group the exclamations into 24 different kinds of emotions, whereas earlier studies capped the emotional variety to 13.
The data in this sound map are the over-2,000 vocal bursts, recorded by the researchers, by 56 male and female participants from the U.S., Kenya, India, and Singapore. The participants included both professional actors and non-actors, and the vocal bursts were responses to “emotionally evocative scenarios.”
The audience of this data visualization is primarily other experts in psychology and human behavior, although it is accessible for any user. As to its goals, according to the press release, “the map could theoretically guide medical professionals and researchers working with people with dementia, autism, and other emotional processing disorders,” to practice recognizing the different nonverbal cues. It also provides insight into human behavior.
It’s unclear what the ‘click and drag’ function of the webpage is supposed to accomplish. Otherwise, the webpage is effective at displaying the data because the sections are clearly labeled and colored as the vocalizations blend from one emotion into the adjacent ones.