Team members: Ayush Chakravarty, Katherine Soule, Nora Wu, Amy Vogel
Introduction
The data say that Boulder Food Rescue was effective in reducing local food insecurity. We want to tell this story because food rescue is an innovative and sustainable way of helping those who are food insecure, and we think this method should be implemented in more cities. Thus, we took on the role of food security advocates in order to educate our target audience – city officials – on this potential solution to food insecurity.
Summary
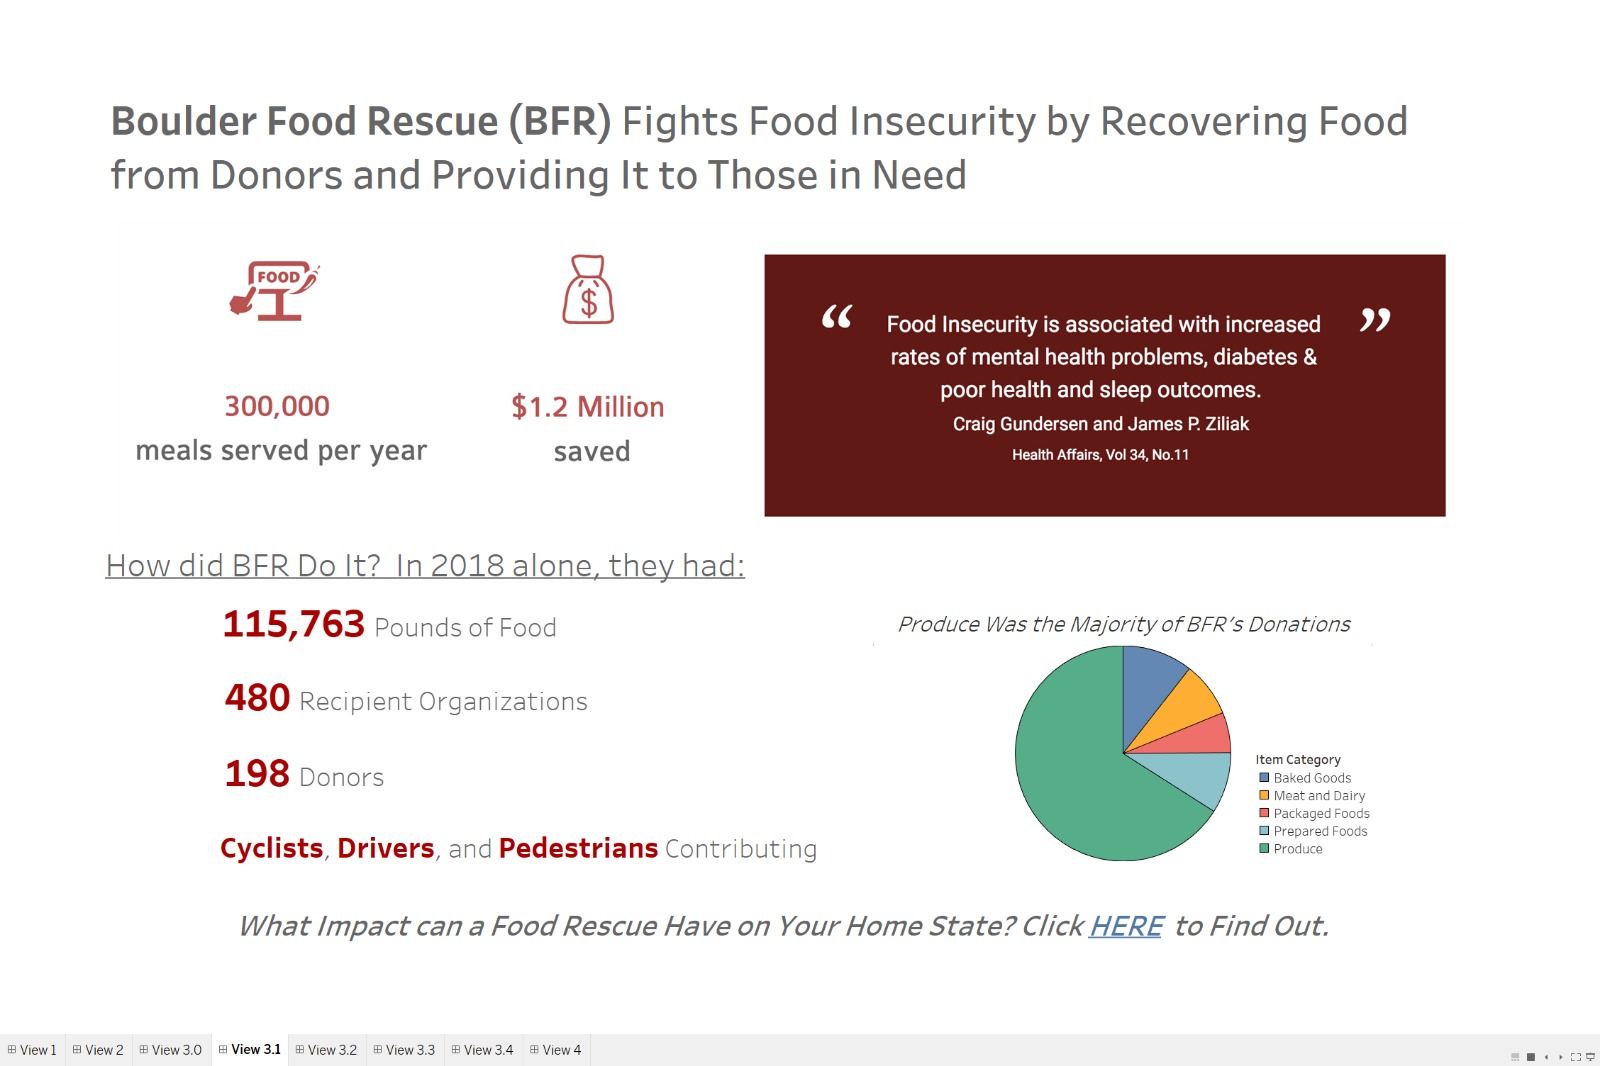
One of our data sources was the Boulder Food Rescue (BFR), which had data on all of their donations in 2018, including details such as the type of food, weight of food, recipient, donor, transport mode used by the donor, and more. This data allowed us to measure the impact that BFR had on Boulder’s food security, as well as to understand the logistics of their operation. Both of these aspects were important for predicting the impact of and ease with which food rescue might be implemented in other cities.
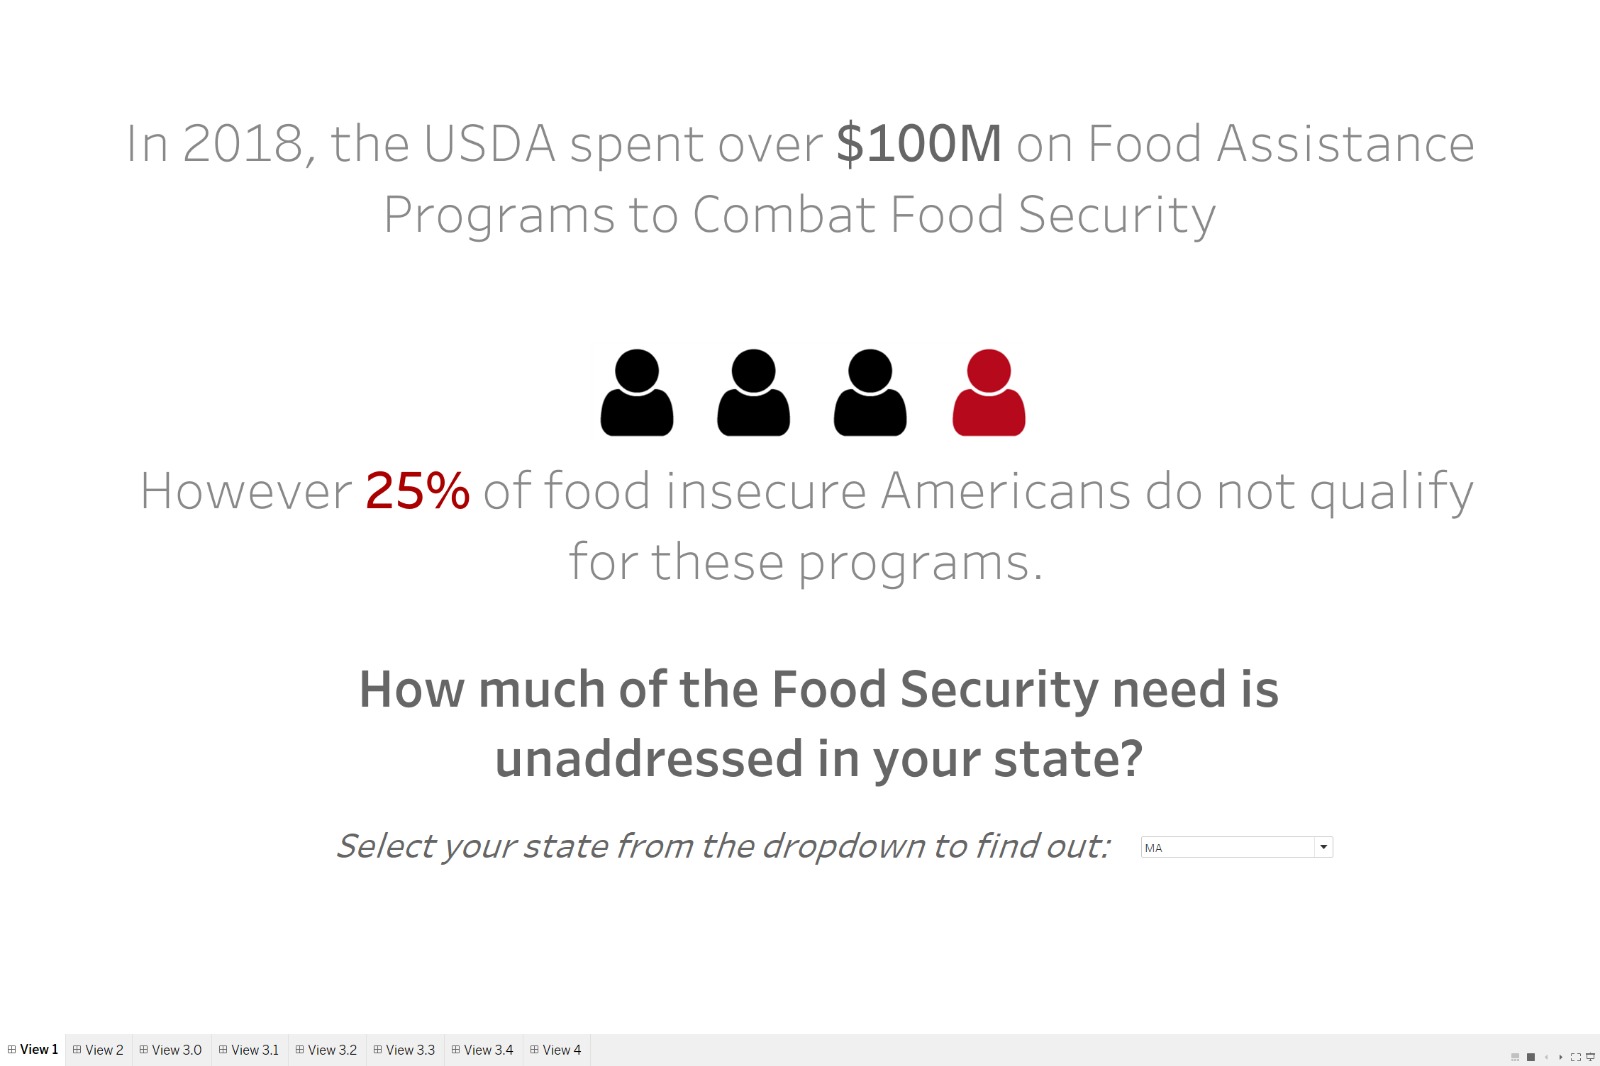
Since our target audience is city officials, we decided that our visualization would be displayed on tablets at a food security conference organized for those city officials. The data is somewhat interactive, so we envisioned people looking through our visualization in the lobby at said conference, in preparation for a session or lecture that would give more details on how food rescue works. Thus, we aimed to create something that would give a high-level overview of (1) why food security matters, (2) BFR’s logistics and impact, and (3) what food rescue could look like for other cities. The goal is to get city officials excited about food rescue as a viable approach and to encourage them to seek more detailed information on the issue.
In line with this goal, our project features 3 separate “pages” or “slides,” which users can click through:
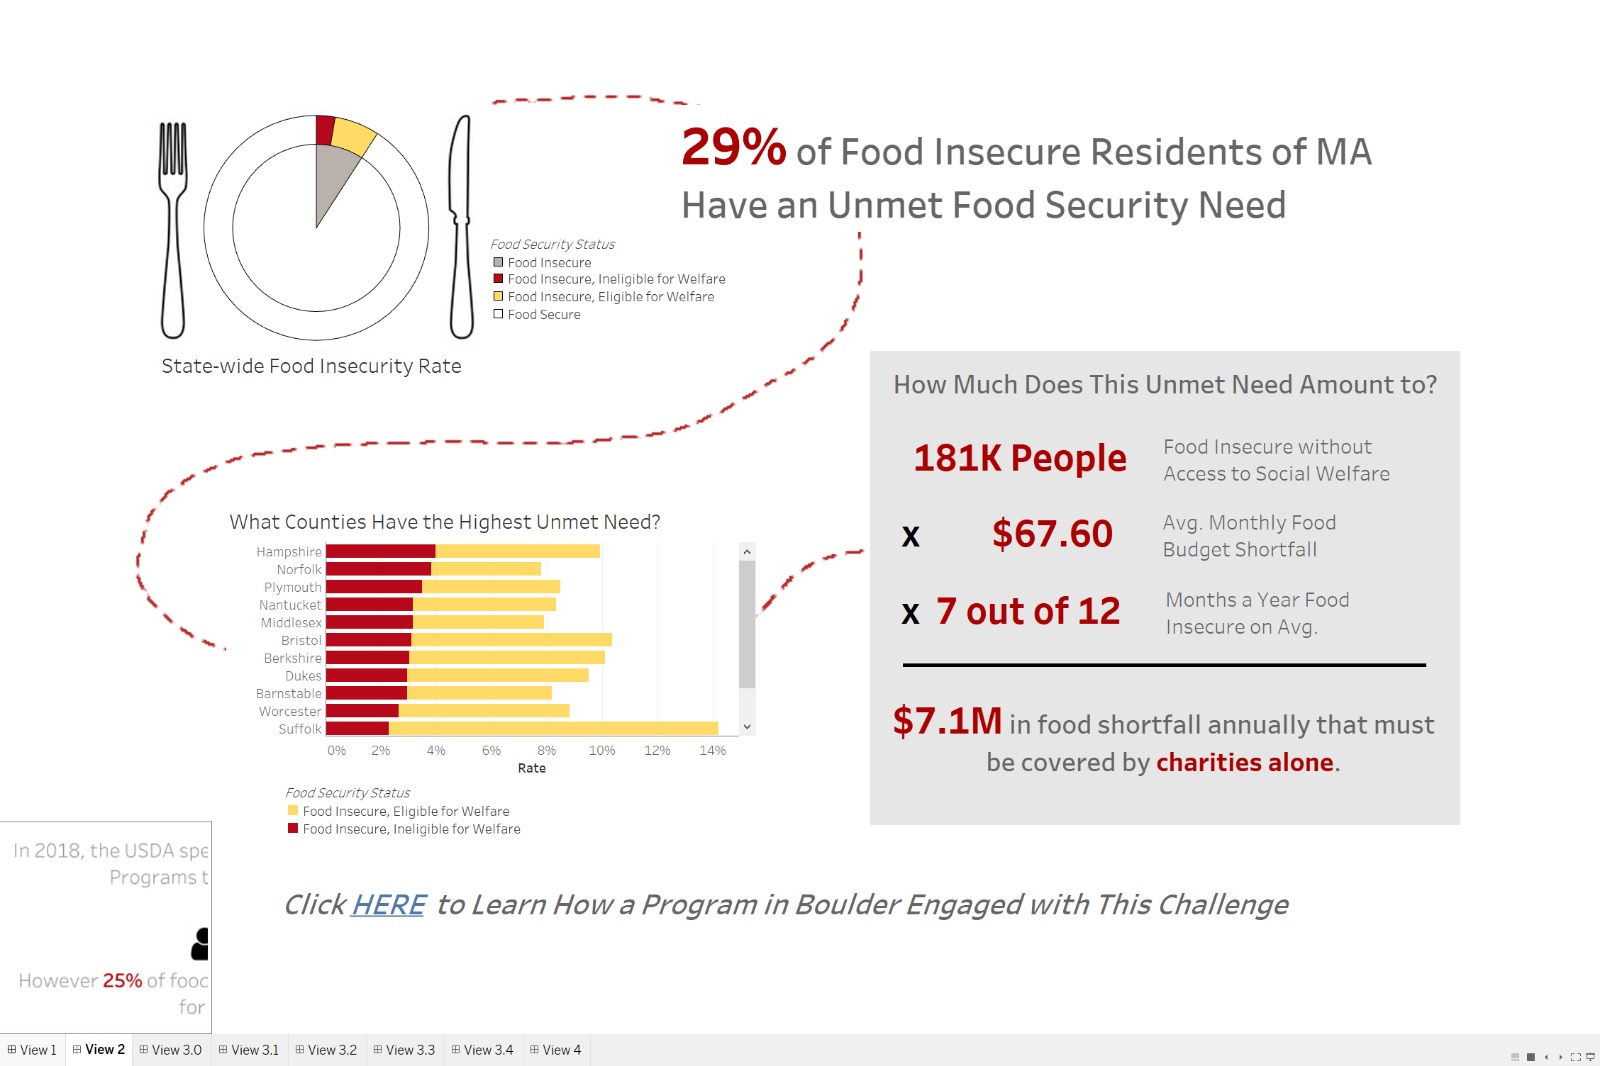
- The first slide explains why food security is a problem in general.
- The second slide shows the impact BFR had in “closing the gap,” and gives some information on how they were able to do that.
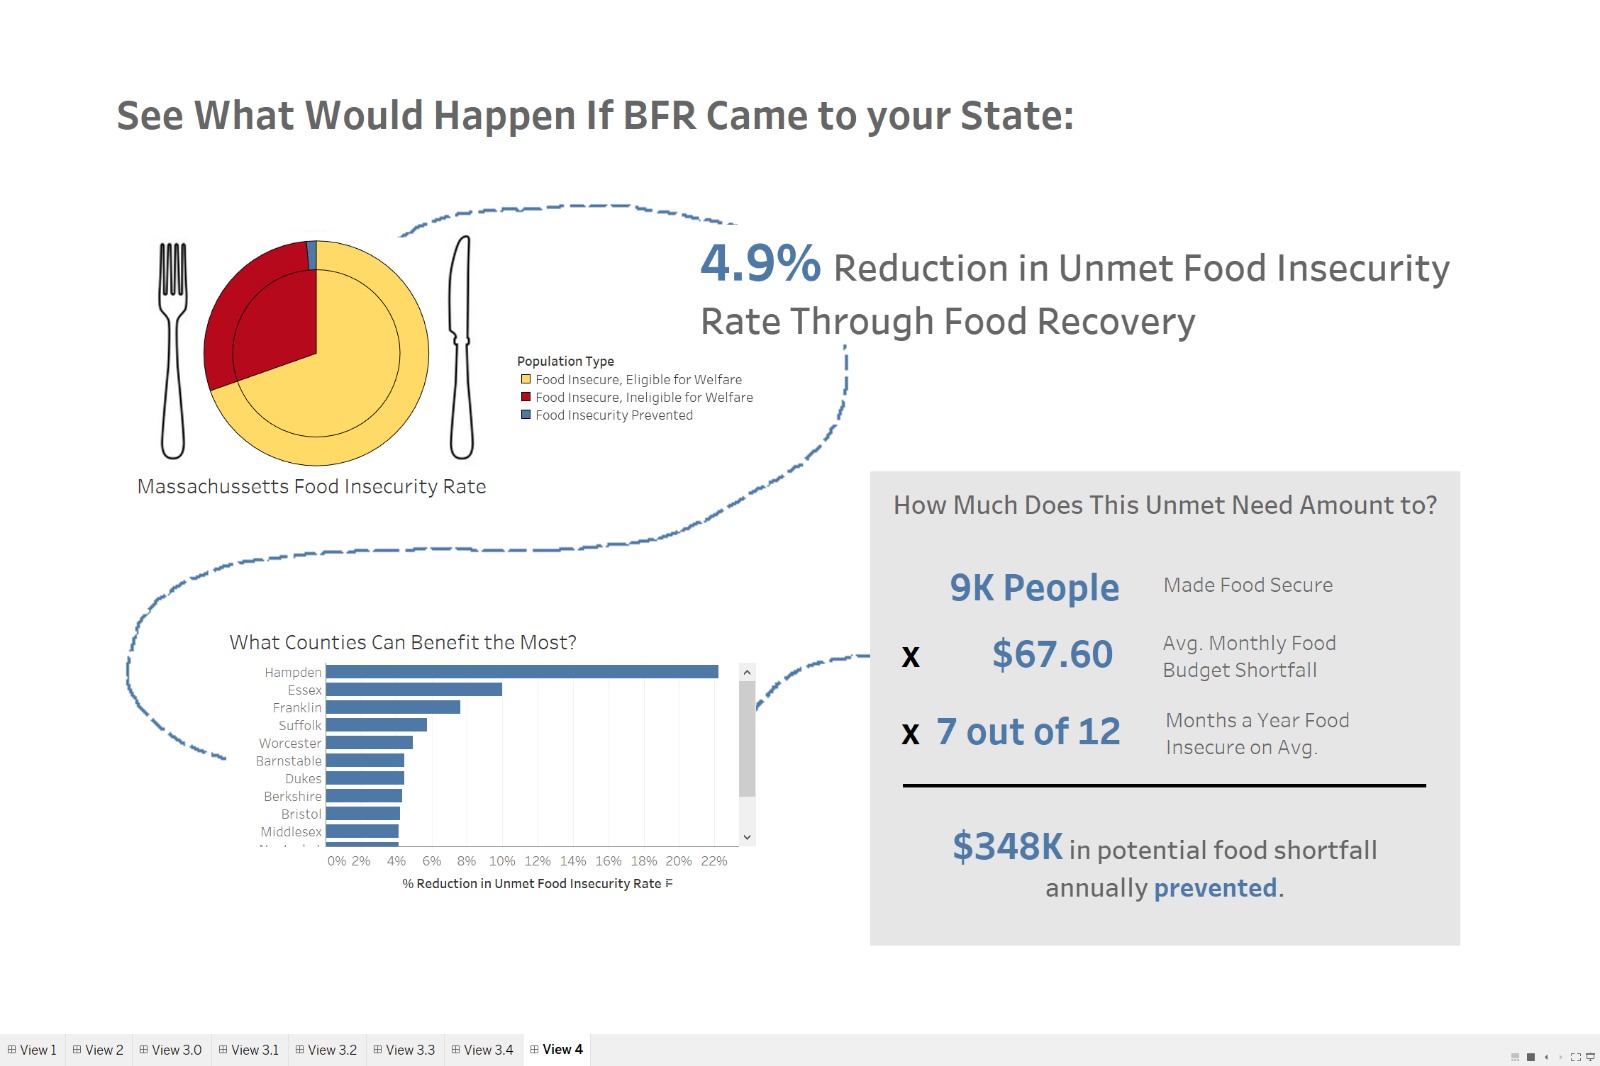
- The final slide emphasizes the potential impact that food rescue could have in your city (i.e. the city where the conference attendee works).
To encourage user interaction, each slide includes some level of interactivity, such as the ability to expand a statistic in order to learn more about it, or hovering over a piece of a chart to get more information on it.