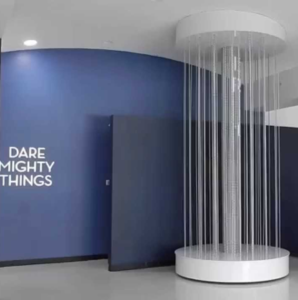
Anyone who enters the visitor center at NASA’s Jet Propulsion Lab gets a few fun treats to take pictures with – a cardboard model of Curiosity, a collection of mission patches; but one of the most eye-catching, and in my opinion, interesting, installations is this large sculpture with flickering lights. After your first glance, you begin to notice the pattern – the outside strands have lights that moves up or down, and the inside cylinder has text that appears on it. This stunning mixture of art and data visualization, JPL’s light sculpture is designed to help non-technical visitors learn just how connected we are with space. Using live data, the sculpture cycles between different US satellites, displaying the name of the current satellite on the central piece, and illustrating the magnitude of the data being uplinked and downlinked from that satellite at the time on the outside. The more data, the more lights will turn on, with uplinks moving up the sculpture, and downlinks moving down.
While this might not communicate detailed technical data, it’s a very effective visualization tool, because it’s targeted towards non-technical guests and tourists. Often, space feels “far off” and removed from daily life – this sculpture intends to form a different impression with visitors to show that the work being done at NASA matters, and that Earth is actually communicating with satellites in space all the time. Although there is an informational stand next to the sculpture, the eye-catching scrolling text allows you to deduce what information is being conveyed without reading the sign.
If you want to see the sculpture in action, check out a video here: